Textbook question for practise - A behavioural psychologist has developed a cognitive-behavioural therapy (CBT) technique modified from classic systematic desensitization to reduce her patients’ phobia of spiders. She decides to test the effectiveness of her new therapy approach by selecting ten patients at random to undergo the treatment for 3 months. The patients were asked to rate how much fear they feel/experience when in the presence of a spider/spiders using a scale from 0 (no fear at all) to 100 (extreme panic and fear). They were tested before and after the therapy. The ratings for each patient are as follows: For this question, be sure to do the following: ▪ State the statistical hypotheses (using the appropriate notation). ▪ Indicate whether the research hypothesis is non-directional or directional (and how you know). ▪ Set the decision rules, which will include: o State alpha - 0.05% o Compute the degrees of freedom o Providing the critical value for the test statistic Sketch the curve and label the rejection region o State the decision rules o Test statistic ▪ Calculate the test statistic. When showing your work for the calculation of the test statistic you can simply insert these values from the output into the formula. You do not need to show all the steps to calculate the mean and standard deviation of the difference scores. ▪ Draw a conclusion (state whether H0 is rejected or not and why you made this decision). ▪ Interpret the result ▪ The SPSS output ▪ On the output, circle and label (using the proper notation) the following quantities: o Mean of the difference scores (MD) o Standard deviation of the difference scores ( sD ) Please show all your work - there should be an explanation for every calculation and number given in answer to clarify your response.


Textbook question for practise -
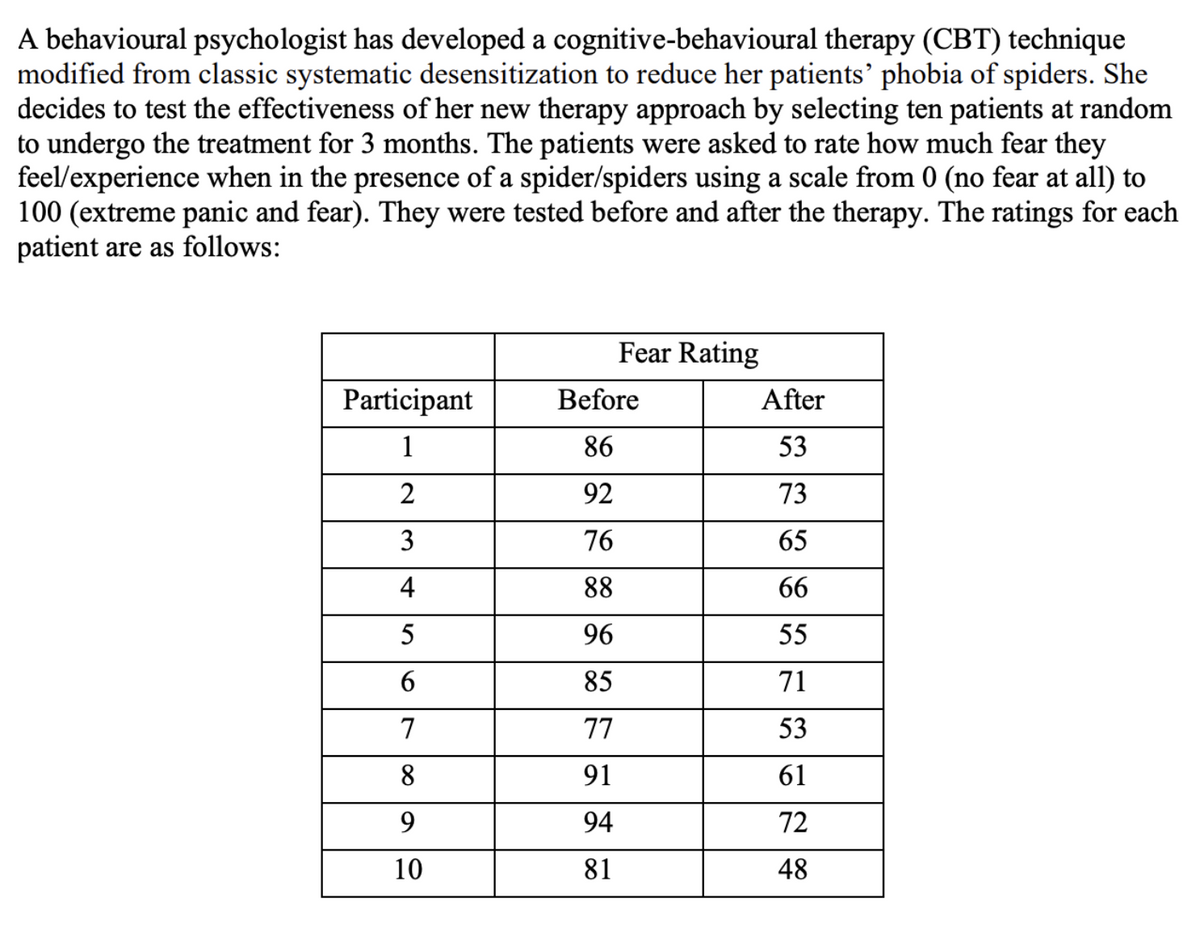
A behavioural psychologist has developed a cognitive-behavioural therapy (CBT) technique modified from classic systematic desensitization to reduce her patients’ phobia of spiders. She decides to test the effectiveness of her new therapy approach by selecting ten patients at random to undergo the treatment for 3 months. The patients were asked to rate how much fear they feel/experience when in the presence of a spider/spiders using a scale from 0 (no fear at all) to 100 (extreme panic and fear). They were tested before and after the therapy. The ratings for each patient are as follows:
For this question, be sure to do the following:
▪ State the statistical hypotheses (using the appropriate notation).
▪ Indicate whether the research hypothesis is non-directional or directional (and how you know).
▪ Set the decision rules, which will include:
o State alpha - 0.05%
o Compute the degrees of freedom
o Providing the critical value for the test statistic
Sketch the curve and label the rejection region
o State the decision rules
o Test statistic
▪ Calculate the test statistic.
When showing your work for the calculation of the test statistic you can simply insert these values from the output into the formula. You do not need to show all the steps to calculate the mean and standard deviation of the difference scores.
▪ Draw a conclusion (state whether H0 is rejected or not and why you made this decision).
▪ Interpret the result
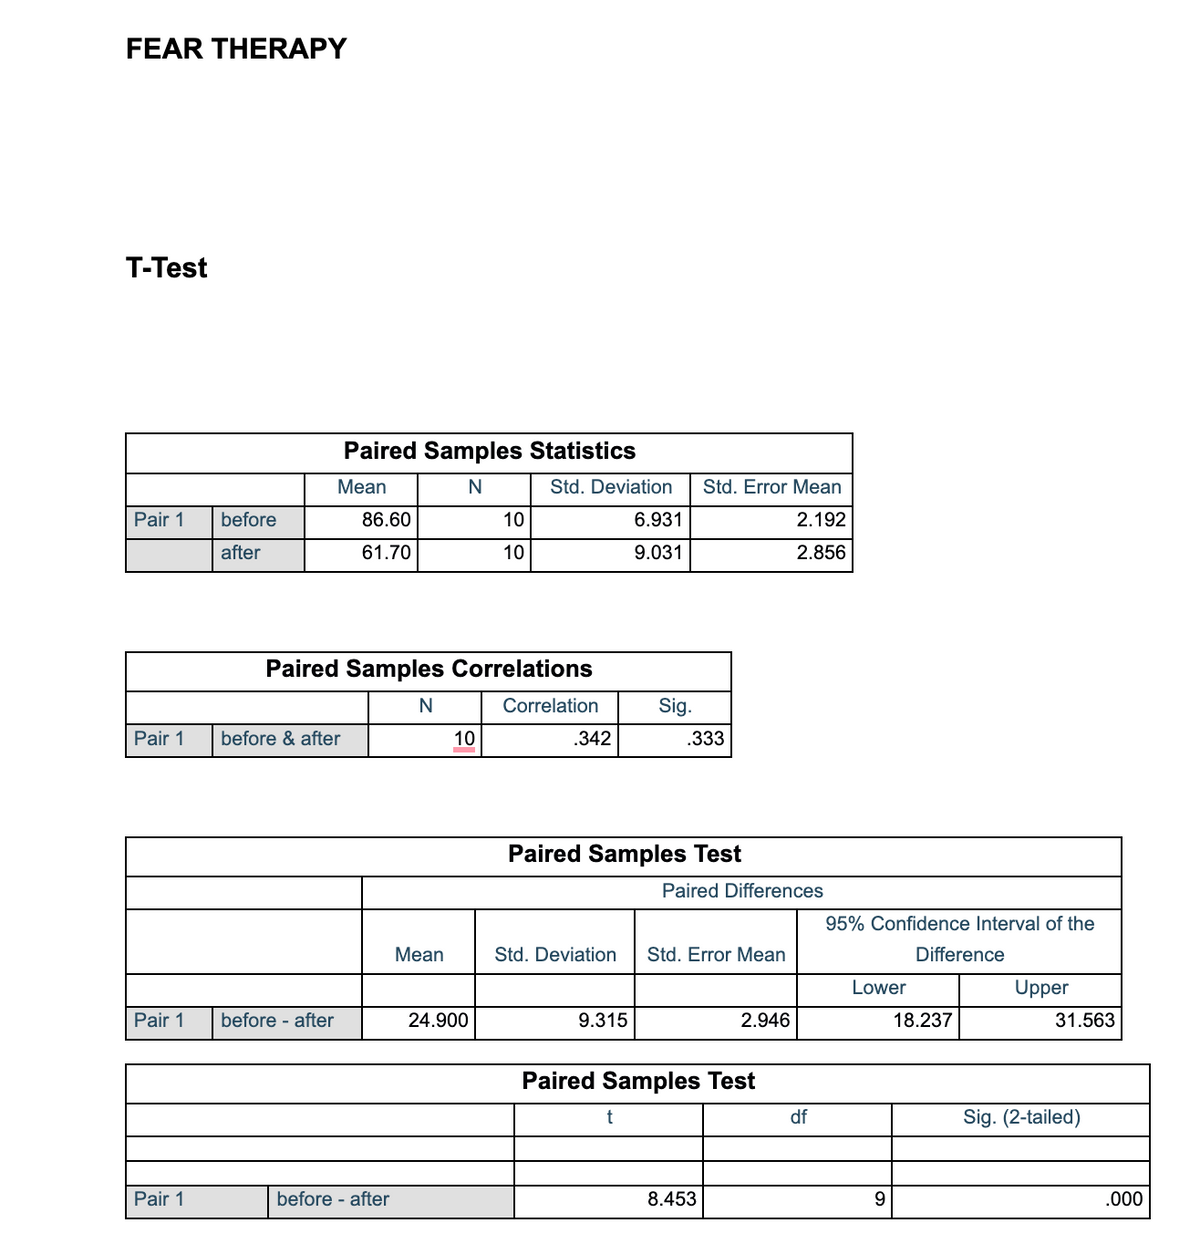
▪ The SPSS output
▪ On the output, circle and label (using the proper notation) the following quantities:
o Mean of the difference scores (MD)
o Standard deviation of the difference scores ( sD )
Please show all your work - there should be an explanation for every calculation and number given in answer to clarify your response.

Step by step
Solved in 2 steps with 2 images


