The 5-mumber summary is 000 andall in mm Hg (Use ascending order Type integers or decimals Do not round) Which boxplot below represents the data? OA.
The 5-mumber summary is 000 andall in mm Hg (Use ascending order Type integers or decimals Do not round) Which boxplot below represents the data? OA.

Mathematics For Machine Technology
8th Edition
ISBN:9781337798310
Author:Peterson, John.
Publisher:Peterson, John.
Chapter29: Tolerance, Clearance, And Interference
Section: Chapter Questions
Problem 16A: Spacers are manufactured to the mean dimension and tolerance shown in Figure 29-12. An inspector...

Related questions
Topic Video
Question
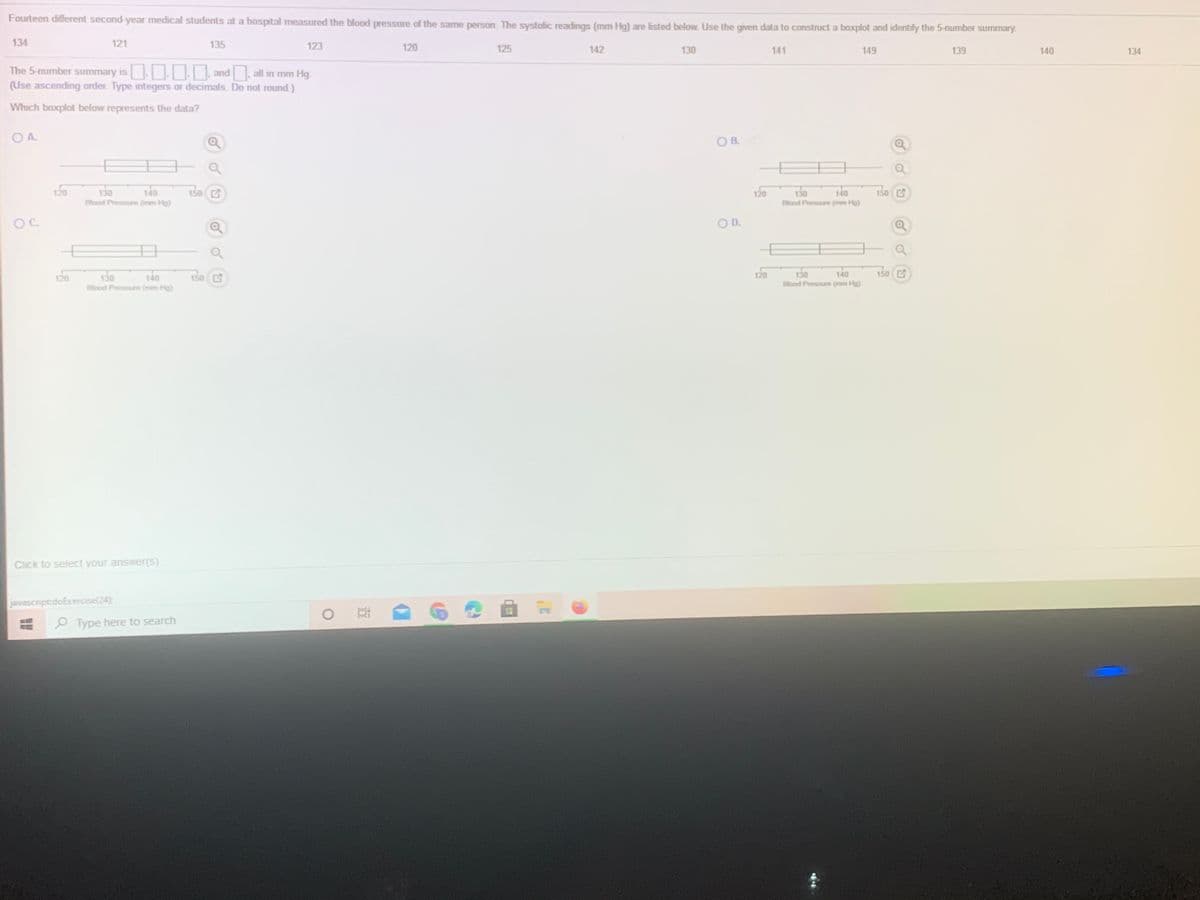
Transcribed Image Text:Fourteen different second-year medical students at a hospital measured the blood pressure of the same person. The systolic readings (mm Hg) are listed below. Use the given data to construct a boxplot and identify the 5-number summary.
134
121
135
123
120
125
142
130
141
149
139
140
134
The 5-number summary is and. all in mm Hg.
(Use ascending order. Type integers or decimals. Do not round.)
Which baxplot below represents the data?
OA.
O B.
120
130
Blood Pressure (mm Hg)
140
150 C
140
120
150 C
130
Blood Pressure (mem Hg)
OC.
OD.
140
120
130
140
150 E
130
Blood Pressure (mm Hg)
120
150 C
Ellood Pressure (mm Hg)
Click to select your answer(s).
javascript:doExercise(24)
O Type here to search
Expert Solution
This question has been solved!
Explore an expertly crafted, step-by-step solution for a thorough understanding of key concepts.

This is a popular solution!

Trending now
This is a popular solution!

Step by step
Solved in 2 steps with 2 images

Knowledge Booster


Learn more about
Need a deep-dive on the concept behind this application? Look no further. Learn more about this topic, statistics and related others by exploring similar questions and additional content below.Recommended textbooks for you
Mathematics For Machine Technology
Advanced Math
ISBN:
9781337798310
Author:
Peterson, John.
Publisher:
Cengage Learning,
Mathematics For Machine Technology
Advanced Math
ISBN:
9781337798310
Author:
Peterson, John.
Publisher:
Cengage Learning,