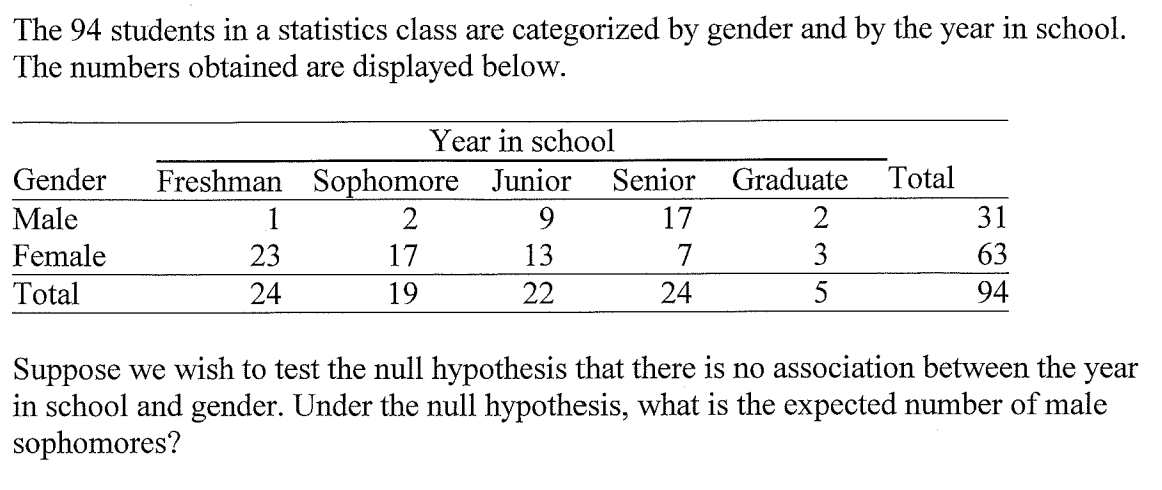
The 94 students in a statistics class are categorized by gender and by the year in school. The numbers obtained are displayed below. Year in school Gender Freshman Sophomore Junior Senior Graduate Total Male 1 2 9 17 2 31 Female 23 17 13 7 3 63 Total 24 19 22 24 5 94 Suppose we wish to test the null hypothesis that there is no association between the year in school and gender. Under the null hypothesis, what is the expected number of male sophomores?
The 94 students in a statistics class are categorized by gender and by the year in school. The numbers obtained are displayed below. Year in school Gender Freshman Sophomore Junior Senior Graduate Total Male 1 2 9 17 2 31 Female 23 17 13 7 3 63 Total 24 19 22 24 5 94 Suppose we wish to test the null hypothesis that there is no association between the year in school and gender. Under the null hypothesis, what is the expected number of male sophomores?

Chapter8: Sequences, Series,and Probability
Section8.7: Probability
Problem 11ECP: A manufacturer has determined that a machine averages one faulty unit for every 500 it produces....

Related questions
Question
Transcribed Image Text:The 94 students in a statistics class are categorized by gender and by the year in school.
The numbers obtained are displayed below.
Year in school
Senior Graduate
Total
Gender Freshman Sophomore Junior
Male
1
2
9
17
2
31
Female
23
17
13
7
3
63
Total
24
19
22
24
5
94
Suppose we wish to test the null hypothesis that there is no association between the year
in school and gender. Under the null hypothesis, what is the expected number of male
sophomores?
Expert Solution
This question has been solved!
Explore an expertly crafted, step-by-step solution for a thorough understanding of key concepts.

This is a popular solution!

Trending now
This is a popular solution!

Step by step
Solved in 2 steps with 1 images

Recommended textbooks for you