What is the probability that the next person surveyed is very prepared?

Chapter8: Sequences, Series,and Probability
Section8.7: Probability
Problem 4ECP: Show that the probability of drawing a club at random from a standard deck of 52 playing cards is...

Related questions
Question
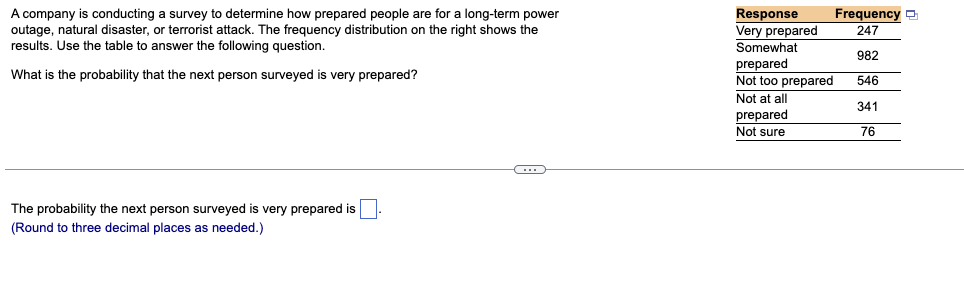
Transcribed Image Text:A company is conducting a survey to determine how prepared people are for a long-term power
outage, natural disaster, or terrorist attack. The frequency distribution on the right shows the
results. Use the table to answer the following question.
What is the probability that the next person surveyed is very prepared?
C
The probability the next person surveyed is very prepared is
(Round to three decimal places as needed.)
Response
Very prepared
Somewhat
prepared
Not too prepared
Not at all
prepared
Not sure
Frequency
247
982
546
341
76
Expert Solution
This question has been solved!
Explore an expertly crafted, step-by-step solution for a thorough understanding of key concepts.

This is a popular solution!

Trending now
This is a popular solution!

Step by step
Solved in 2 steps

Recommended textbooks for you

Holt Mcdougal Larson Pre-algebra: Student Edition…
Algebra
ISBN:
9780547587776
Author:
HOLT MCDOUGAL
Publisher:
HOLT MCDOUGAL
Holt Mcdougal Larson Pre-algebra: Student Edition…
Algebra
ISBN:
9780547587776
Author:
HOLT MCDOUGAL
Publisher:
HOLT MCDOUGAL