The ABZ Medical Association compiles information on physicians in a state and found that they can be broadly classified into four categories: general practice, medical, surgical and other, as shown in Table 1 below. The percentage of those categories are 18.0%, 33.9%, 27.0% and 21.1%, respectively. A researcher wants to know whether the specialty distribution of physicians in that state is different from the percentage given. At the 5% significance level, do the distribution is different from the claim?


The ABZ Medical Association compiles information on physicians in a state and found that they can be broadly classified into four categories: general practice, medical, surgical and other, as shown in Table 1 below. The percentage of those categories are 18.0%, 33.9%, 27.0% and 21.1%, respectively. A researcher wants to know whether the specialty distribution of physicians in that state is different from the percentage given. At the 5% significance level, do the distribution is different from the claim?
| specialty | frequency |
| general practice | 80 |
| medical | 162 |
| surgical | 156 |
| other | 102 |
Null and alternative hypothesis:
Denote the proportion of physicians classified into general practice category as p1.
Denote the proportion of physicians classified into medical category as p2.
Denote the proportion of physicians classified into surgical category as p3.
Denote the proportion of physicians classified into others category as p4.
The expected proportions are given as below:
p1 = 18% = 0.18, p2 = 33.9% = 0.339, p3 = 27% = 0.27 and p4 = 21.1% = 0.211.
The hypotheses to be tested are:
Null hypothesis:
H0: p1 = 0.18, p2 = 0.339, p3 = 0.27 and p4 = 0.211.
That is, the speciality distribution is not significantly different from the given percentages.
Alternative hypothesis:
Ha: Any one of the expected proportions is not true.
That is, the speciality distribution is significantly different from the given percentages.
Test for the assumptions of the test:
The necessary assumptions for Chi-square test for goodness of fit are given below:
- The sample should be collected using simple random sampling.
- The variable of interest must be categorical.
- The expected value of each cell should not be less than 5.
The expected and observed frequencies for the given data are obtained as given below:
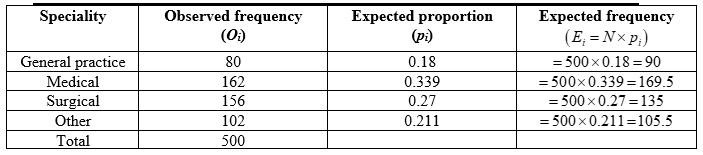
From the above table, the expected frequencies for none of the cells are less than 5.
All the 3 assumptions are satisfied.

Step by step
Solved in 2 steps with 4 images


