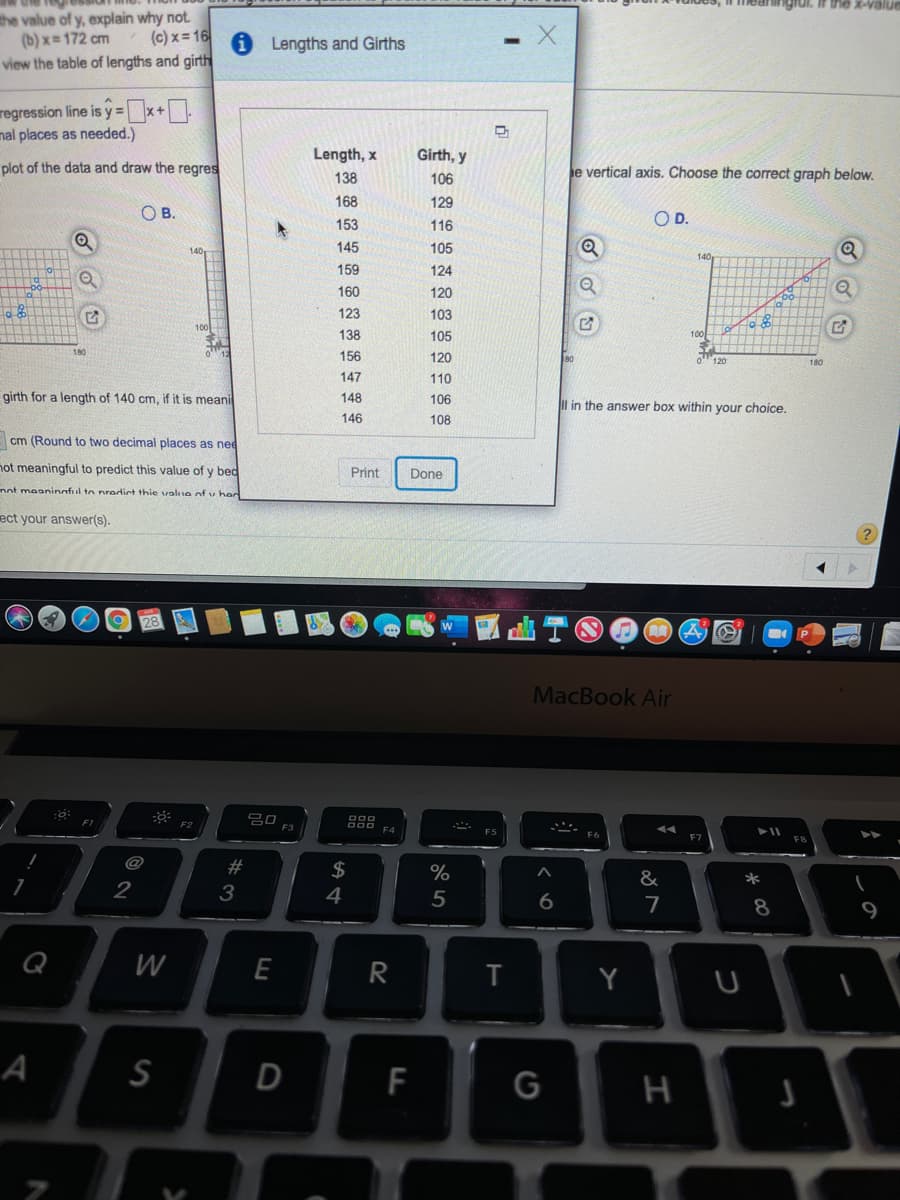
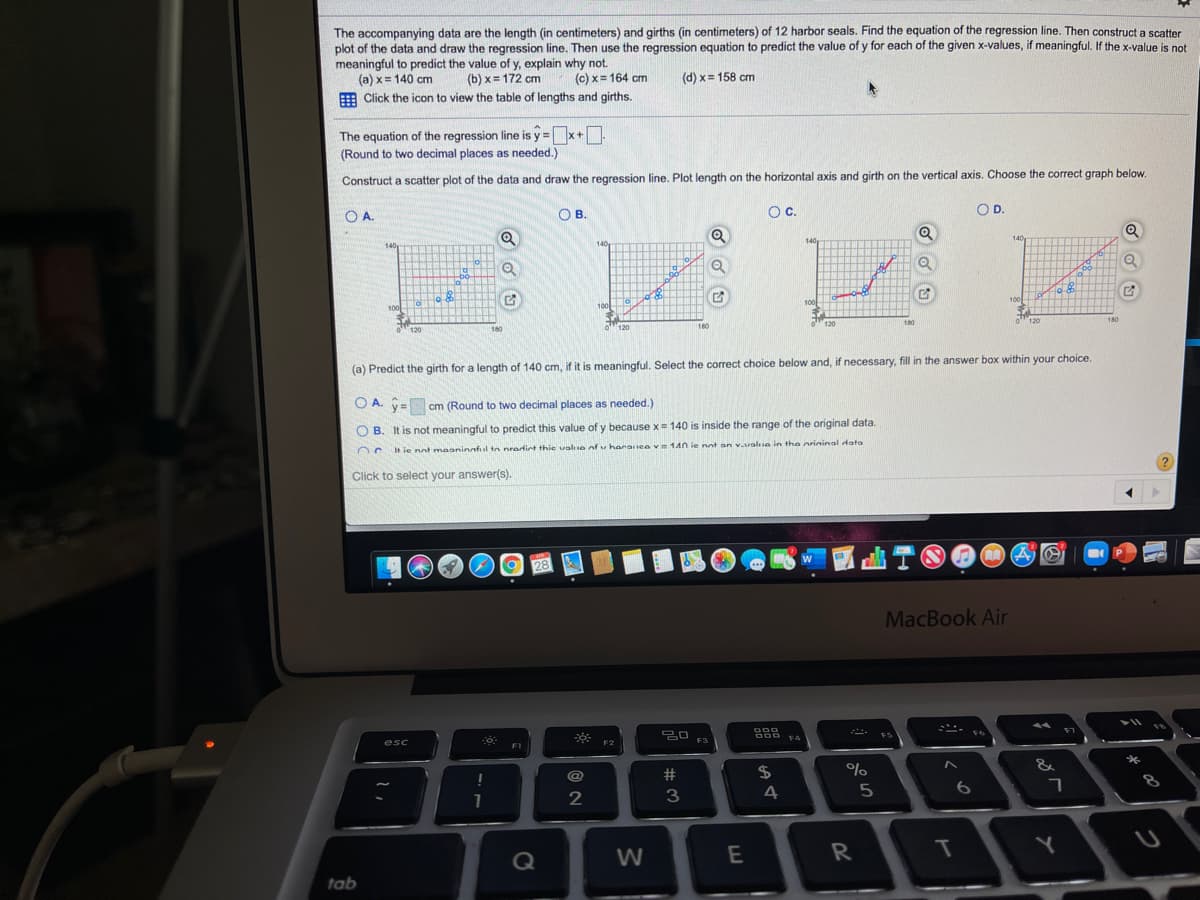
The accompanying data are the length (in centimeters) and girths (in centimeters) of 12 harbor seals. Find the equation of the regression line. Then construct a scatter plot of the data and draw the regression line. Then use the regression equation to predict the value of y for each of the given x-values, if meaningful. If the x-value is not meaningful to predict the value of y, explain why not. (a) x= 140 cm H Click the icon to view the table of lengths and girths. (b) x = 172 cm (c) x= 164 cm (d) x= 158 cm The equation of the regression line is y =x+ (Round to two decimal places as needed.) Construct a scatter plot of the data and draw the regression line. Plot length on the horizontal axis and girth on the vertical axis. Choose the correct graph below. OA. OB. OC. OD. 140 140 10 100 100 100 100 120 180 120 180 120 180 120 180 (a) Predict the girth for a length of 140 cm, if it is meaningful. Select the correct choice below and, if necessary, fill in the answer box within your choice.


Correlation
Correlation defines a relationship between two independent variables. It tells the degree to which variables move in relation to each other. When two sets of data are related to each other, there is a correlation between them.
Linear Correlation
A correlation is used to determine the relationships between numerical and categorical variables. In other words, it is an indicator of how things are connected to one another. The correlation analysis is the study of how variables are related.
Regression Analysis
Regression analysis is a statistical method in which it estimates the relationship between a dependent variable and one or more independent variable. In simple terms dependent variable is called as outcome variable and independent variable is called as predictors. Regression analysis is one of the methods to find the trends in data. The independent variable used in Regression analysis is named Predictor variable. It offers data of an associated dependent variable regarding a particular outcome.


Trending now
This is a popular solution!

Step by step
Solved in 2 steps with 1 images


