The accompanying data are the number of wins and the earmed run averages (mean number of earned runs allowed per nine innings pitched) for eight baseball pitchers in a recent season. Find the equation of the regression line. Then construct a scatter plot of the data and draw the regression line. Then use the regression equation to predict the value of y for each of the given x-values, if meaningful. If the x-value is not meaningful to predict the value of y, explain why not. (a) x=5 wins E Click the icon to view the table of numbers of wins and earned run average. (b) x= 10 wins (c) x= 19 wins (d) x= 15 wins Wins and ERA The equation of the regression line is y =x+ (Round to two decimal places as needed.) Construct a scatter plot of the data and draw the regression line. Choose Earned run O A. OB. Wins, x average, y 2.82 AERA 6- AERA 20 18 3.34 4- 4- 17 2.59 16 3.72 2- 2- 14 3.85 0- 12 4.31 12 18 24 12 18 24 Wins 11 3.81 Wins 5.05 (a) Predict the ERA for 5 wins, if it is meaningful. Select the correct choid O A. y= (Round to two decimal places as needed.) Print Done It in not moaningfiol to prodint thic valun of u hnun v-E ie not Next
The accompanying data are the number of wins and the earmed run averages (mean number of earned runs allowed per nine innings pitched) for eight baseball pitchers in a recent season. Find the equation of the regression line. Then construct a scatter plot of the data and draw the regression line. Then use the regression equation to predict the value of y for each of the given x-values, if meaningful. If the x-value is not meaningful to predict the value of y, explain why not. (a) x=5 wins E Click the icon to view the table of numbers of wins and earned run average. (b) x= 10 wins (c) x= 19 wins (d) x= 15 wins Wins and ERA The equation of the regression line is y =x+ (Round to two decimal places as needed.) Construct a scatter plot of the data and draw the regression line. Choose Earned run O A. OB. Wins, x average, y 2.82 AERA 6- AERA 20 18 3.34 4- 4- 17 2.59 16 3.72 2- 2- 14 3.85 0- 12 4.31 12 18 24 12 18 24 Wins 11 3.81 Wins 5.05 (a) Predict the ERA for 5 wins, if it is meaningful. Select the correct choid O A. y= (Round to two decimal places as needed.) Print Done It in not moaningfiol to prodint thic valun of u hnun v-E ie not Next

Functions and Change: A Modeling Approach to College Algebra (MindTap Course List)
6th Edition
ISBN:9781337111348
Author:Bruce Crauder, Benny Evans, Alan Noell
Publisher:Bruce Crauder, Benny Evans, Alan Noell
Chapter3: Straight Lines And Linear Functions
Section3.CR: Chapter Review Exercises
Problem 15CR: Life Expectancy The following table shows the average life expectancy, in years, of a child born in...

Related questions
Question
Answer these questions
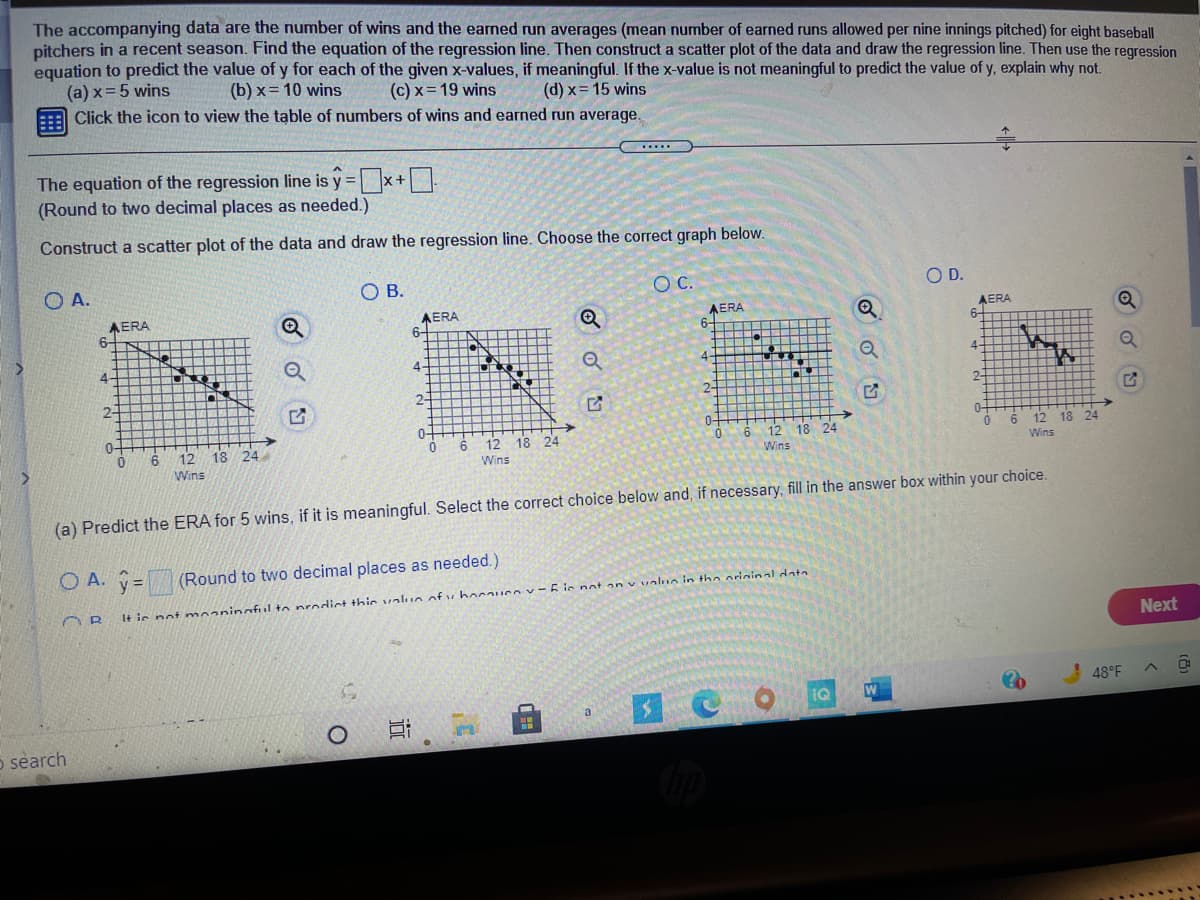
Transcribed Image Text:The accompanying data are the number of wins and the earned run averages (mean number of earned runs allowed per nine innings pitched) for eight baseball
pitchers in a recent season. Find the equation of the regression line. Then construct a scatter plot of the data and draw the regression line. Then use the regression
equation to predict the value of y for each of the given x-values, if meaningful. If the x-value is not meaningful to predict the value of y, explain why not.
(a) x= 5 wins
Click the icon to view the table of numbers of wins and earned run average,
(b) x= 10 wins
(c) x= 19 wins
(d) x= 15 wins
The equation of the regression line is y =x+
(Round to two decimal places as needed.)
Construct a scatter plot of the data and draw the regression line. Choose the correct graph below.
O A.
OB.
OD.
AERA
AERA
6-
AERA
AERA
6-
6-
6-
4-
4-
4.
2-
2-
2-
2-
0-
0-
12 18 24
12
18
24
12
18 24
12
18
Wins
Wins
Wins
Wins
(a) Predict the ERA for 5 wins, if it is meaningful. Select the correct choice below and, if necessary, fill in the answer box within your choice.
O A. =
(Round to two decimal places as needed.)
It ie not moaninafual to prodint thic valuin of v hocause v-E ie not an v ualun in tho ariginal data
Next
48°F
IQ
o search
近
Transcribed Image Text:The accompanying data are the number of wins and the earned run averages (mean number of earned runs allowed per nine innings pitched) for eight baseball
pitchers in a recent season. Find the equation of the regression line. Then construct a scatter plot of the data and draw the regression line. Then use the regression
equation to predict the value of y for each of the given x-values, if meaningful. If the x-value is not meaningful to predict the value of y, explain why not.
(a) x= 5 wins
E Click the icon to view the table of numbers of wins and earned run average.
(b) x= 10 wins
(c) x = 19 wins
(d) x = 15 wins
The equation of the regression line is y =
(Round to two decimal places as needed.)
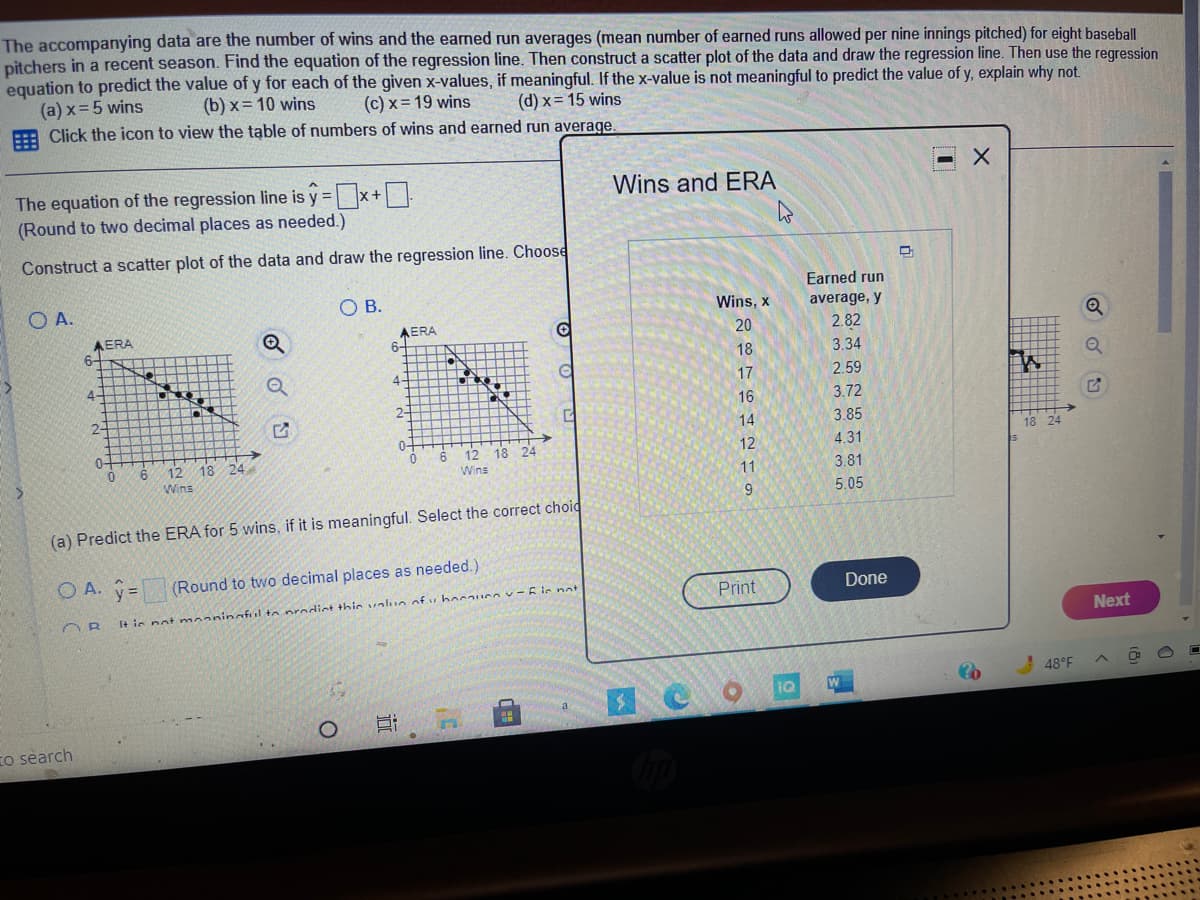
Wins and ERA
Construct a scatter plot of the data and draw the regression line. Choose
Earned run
O A.
O B.
Wins, x
average, y
AERA
6-
AERA
6-
2.82
20
18
3.34
4
4-
17
2.59
16
3.72
2-
2-
14
3.85
0-
18
0-
12
18 24
12
4.31
12
18
Wins
11
3.81
Wins
9.
5.05
(a) Predict the ERA for 5 wins, if it is meaningful. Select the correct choid
O A. y=
(Round to two decimal places as needed.)
Print
Done
I+ ie not maaninafl to prodint thic valun of v hnuce v-E ie not
Next
48°F
To search
近
Expert Solution
This question has been solved!
Explore an expertly crafted, step-by-step solution for a thorough understanding of key concepts.

This is a popular solution!

Trending now
This is a popular solution!

Step by step
Solved in 7 steps with 6 images

Recommended textbooks for you
Functions and Change: A Modeling Approach to Coll…
Algebra
ISBN:
9781337111348
Author:
Bruce Crauder, Benny Evans, Alan Noell
Publisher:
Cengage Learning

College Algebra
Algebra
ISBN:
9781305115545
Author:
James Stewart, Lothar Redlin, Saleem Watson
Publisher:
Cengage Learning

Algebra & Trigonometry with Analytic Geometry
Algebra
ISBN:
9781133382119
Author:
Swokowski
Publisher:
Cengage
Functions and Change: A Modeling Approach to Coll…
Algebra
ISBN:
9781337111348
Author:
Bruce Crauder, Benny Evans, Alan Noell
Publisher:
Cengage Learning
College Algebra
Algebra
ISBN:
9781305115545
Author:
James Stewart, Lothar Redlin, Saleem Watson
Publisher:
Cengage Learning
Algebra & Trigonometry with Analytic Geometry
Algebra
ISBN:
9781133382119
Author:
Swokowski
Publisher:
Cengage

Algebra and Trigonometry (MindTap Course List)
Algebra
ISBN:
9781305071742
Author:
James Stewart, Lothar Redlin, Saleem Watson
Publisher:
Cengage Learning


Glencoe Algebra 1, Student Edition, 9780079039897…
Algebra
ISBN:
9780079039897
Author:
Carter
Publisher:
McGraw Hill