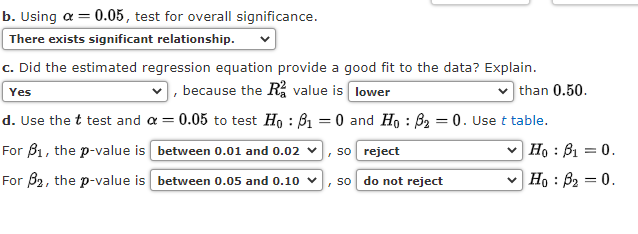
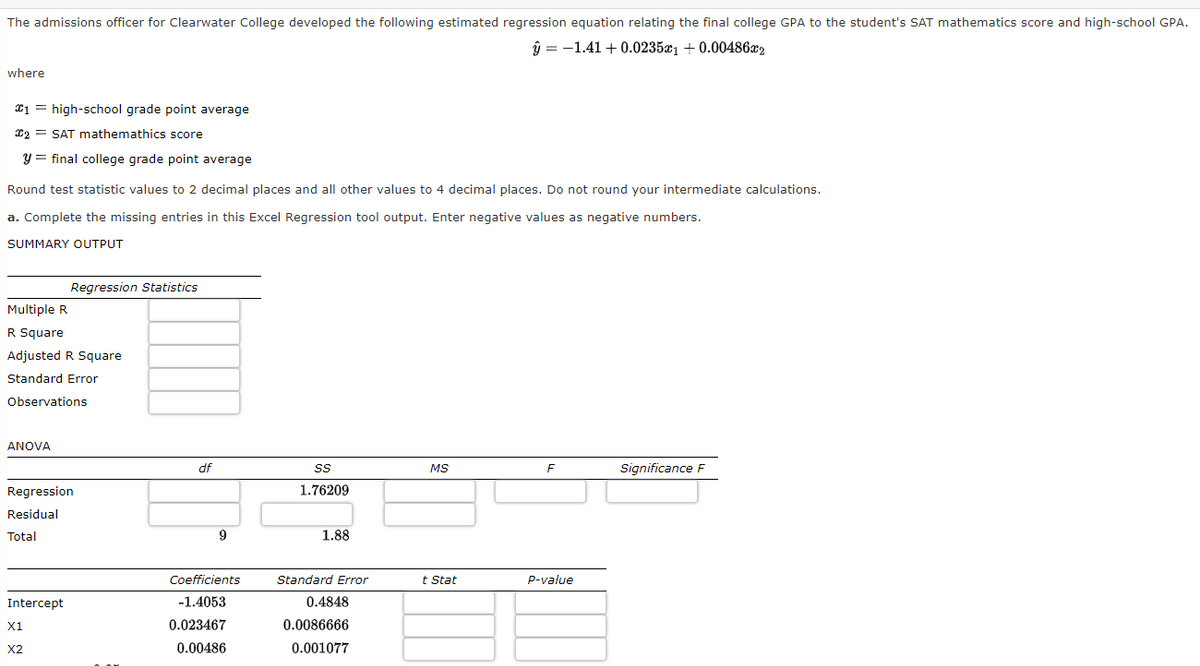
The admissions officer for Clearwater College developed the following estimated regression equation relating the final college GPA to the student's SAT mathematics score and hi ŷ = -1.41 + 0.0235¤1 + 0.00486x2 where I1 = high-school grade point average 12 = SAT mathemathics score y = final college grade point average Round test statistic values to 2 decimal places and all other values to 4 decimal places. Do not round your intermediate calculations. a. Complete the missing entries in this Excel Regression tool output. Enter negative values as negative numbers. SUMMARY OUTPUT Regression Statistics Multiple R R Square Adjusted R Square Standard Error Observations ANOVA df MS F Significance F Regression 1.76209 Residual Total 9 1.88 Coefficients Standard Error t Stat P-value Intercept -1.4053 0.4848 X1 0.023467 0.0086666 X2 0.00486 0.001077


Correlation
Correlation defines a relationship between two independent variables. It tells the degree to which variables move in relation to each other. When two sets of data are related to each other, there is a correlation between them.
Linear Correlation
A correlation is used to determine the relationships between numerical and categorical variables. In other words, it is an indicator of how things are connected to one another. The correlation analysis is the study of how variables are related.
Regression Analysis
Regression analysis is a statistical method in which it estimates the relationship between a dependent variable and one or more independent variable. In simple terms dependent variable is called as outcome variable and independent variable is called as predictors. Regression analysis is one of the methods to find the trends in data. The independent variable used in Regression analysis is named Predictor variable. It offers data of an associated dependent variable regarding a particular outcome.


Trending now
This is a popular solution!

Step by step
Solved in 3 steps


