0.65264825 R Square 0.611783338 Error 2.222508989 cions 20 df SS 157 7777145

Algebra & Trigonometry with Analytic Geometry
13th Edition
ISBN:9781133382119
Author:Swokowski
Publisher:Swokowski
Chapter5: Inverse, Exponential, And Logarithmic Functions
Section5.6: Exponential And Logarithmic Equations
Problem 67E
icon
Related questions
Question

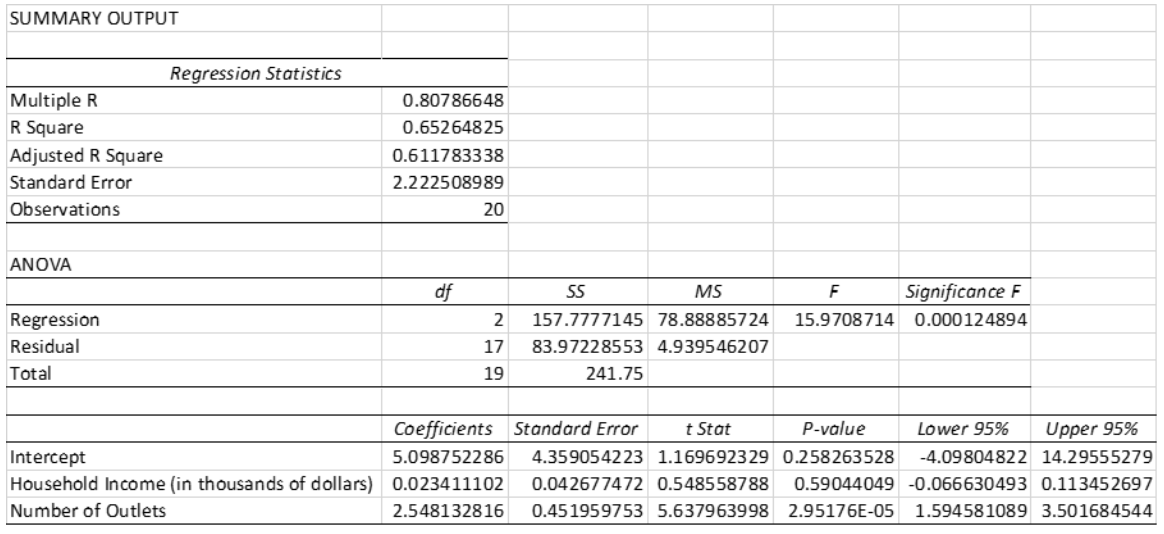
To predict the market share of one of their products, a manufacturer of consumer electronics products hired a market research company to conduct a study that relates market share in a particular geographic region (in %) to the average annual household income and the number of retail outlets per 100,000 residents. The results of a multiple regression model to predict market share from Household income (in thousands of dollars) and number of outlets per 100,000 residents are given below.


a) How much of the variation in market share can this model predict? Is this statistically significant?

b) Someone claims that each additional outlet will increase the market share by more than 1.5%, regardless of what the household income is. Perform the appropriate hypothesis test to check this claim with a 5% significance level.

c) What increase in market share would your model predict for every two additional retail outlets in a region where the annual household income is $75,000? Find a 95% confidence interval for this increase.

SUMMARY OUTPUT
Regression Statistics
Multiple R
0.80786648
R Square
0.65264825
Adjusted R Square
0.611783338
Standard Error
2.222508989
Observations
20
ANOVA
df
SS
MS
Significance F
Regression
2
157.7777145 78.88885724
15.9708714 0.000124894
Residual
17
83.97228553 4.939546207
Total
19
241.75
Coefficients Standard Error
t Stat
P-value
Lower 95%
Upper 95%
Intercept
5.098752286
4.359054223 1.169692329 0.258263528
-4.09804822 14.29555279
Household Income (in thousands of dollars) 0.023411102
0.042677472 0.548558788
0.59044049 -0.066630493 0.113452697
Number of Outlets
2.548132816
0.451959753 5.637963998
2.95176E-05
1.594581089 3.501684544
Transcribed Image Text:SUMMARY OUTPUT Regression Statistics Multiple R 0.80786648 R Square 0.65264825 Adjusted R Square 0.611783338 Standard Error 2.222508989 Observations 20 ANOVA df SS MS Significance F Regression 2 157.7777145 78.88885724 15.9708714 0.000124894 Residual 17 83.97228553 4.939546207 Total 19 241.75 Coefficients Standard Error t Stat P-value Lower 95% Upper 95% Intercept 5.098752286 4.359054223 1.169692329 0.258263528 -4.09804822 14.29555279 Household Income (in thousands of dollars) 0.023411102 0.042677472 0.548558788 0.59044049 -0.066630493 0.113452697 Number of Outlets 2.548132816 0.451959753 5.637963998 2.95176E-05 1.594581089 3.501684544
Expert Solution
steps

Step by step

Solved in 2 steps with 2 images

Blurred answer
Similar questions
  • SEE MORE QUESTIONS
Recommended textbooks for you
Algebra & Trigonometry with Analytic Geometry
Algebra
ISBN:
9781133382119
Author:
Swokowski
Publisher:
Cengage
Big Ideas Math A Bridge To Success Algebra 1: Stu…
Algebra
ISBN:
9781680331141
Author:
HOUGHTON MIFFLIN HARCOURT
Publisher:
Houghton Mifflin Harcourt
Linear Algebra: A Modern Introduction
Algebra
ISBN:
9781285463247
Author:
David Poole
Publisher:
Cengage Learning