The accompanying data are the number of wins and the earned run averages (mean number of earned runs allowed per nine innings pitched) for eight baseball pitchers in a recent season. Find the equatio Then construct a scatter plot of the data and draw the regression line. Then use the regression equation to predict the value of y for each of the given x-values, if meaningful. If the x-value is not meaningful explain why not. (a) x = 5 wins (b)x= 10 wins (c) x = 19 wins (d) x = 15 wins Click the icon to view the table of numbers of wins and earned run average. Wins and ERA O The equation of the regression line is y=x+ (Round to two decimal places as needed.) Wins, x 20 18 17 16 14 12 11 9 Earned run average, y 2.72 3.26 2.59 3.68 3.94 4.37 3.82 5.06
The accompanying data are the number of wins and the earned run averages (mean number of earned runs allowed per nine innings pitched) for eight baseball pitchers in a recent season. Find the equatio Then construct a scatter plot of the data and draw the regression line. Then use the regression equation to predict the value of y for each of the given x-values, if meaningful. If the x-value is not meaningful explain why not. (a) x = 5 wins (b)x= 10 wins (c) x = 19 wins (d) x = 15 wins Click the icon to view the table of numbers of wins and earned run average. Wins and ERA O The equation of the regression line is y=x+ (Round to two decimal places as needed.) Wins, x 20 18 17 16 14 12 11 9 Earned run average, y 2.72 3.26 2.59 3.68 3.94 4.37 3.82 5.06

Functions and Change: A Modeling Approach to College Algebra (MindTap Course List)
6th Edition
ISBN:9781337111348
Author:Bruce Crauder, Benny Evans, Alan Noell
Publisher:Bruce Crauder, Benny Evans, Alan Noell
Chapter3: Straight Lines And Linear Functions
Section3.CR: Chapter Review Exercises
Problem 15CR: Life Expectancy The following table shows the average life expectancy, in years, of a child born in...

Related questions
Question
14
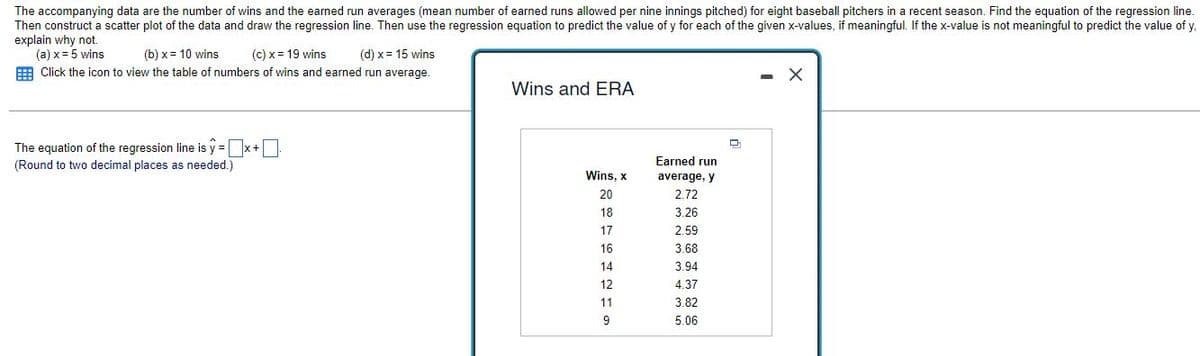
Transcribed Image Text:The accompanying data are the number of wins and the earned run averages (mean number of earned runs allowed per nine innings pitched) for eight baseball pitchers in a recent season. Find the equation of the regression line.
Then construct a scatter plot of the data and draw the regression line. Then use the regression equation to predict the value of y for each of the given x-values, if meaningful. If the x-value is not meaningful to predict the value of y.
explain why not.
(a) x = 5 wins
(b)x= 10 wins
(c) x = 19 wins (d) x = 15 wins
Click the icon to view the table of numbers of wins and earned run average.
X
Wins and ERA
D
The equation of the regression line is y=x+0
(Round to two decimal places as needed.)
Wins, x
20
18
17
16
14
12
11
9
Earned run
average, y
2.72
3.26
2.59
3.68
3.94
4.37
3.82
5.06
Expert Solution
This question has been solved!
Explore an expertly crafted, step-by-step solution for a thorough understanding of key concepts.

This is a popular solution!

Trending now
This is a popular solution!

Step by step
Solved in 2 steps

Recommended textbooks for you
Functions and Change: A Modeling Approach to Coll…
Algebra
ISBN:
9781337111348
Author:
Bruce Crauder, Benny Evans, Alan Noell
Publisher:
Cengage Learning


Glencoe Algebra 1, Student Edition, 9780079039897…
Algebra
ISBN:
9780079039897
Author:
Carter
Publisher:
McGraw Hill
Functions and Change: A Modeling Approach to Coll…
Algebra
ISBN:
9781337111348
Author:
Bruce Crauder, Benny Evans, Alan Noell
Publisher:
Cengage Learning
Glencoe Algebra 1, Student Edition, 9780079039897…
Algebra
ISBN:
9780079039897
Author:
Carter
Publisher:
McGraw Hill


Algebra & Trigonometry with Analytic Geometry
Algebra
ISBN:
9781133382119
Author:
Swokowski
Publisher:
Cengage

Algebra and Trigonometry (MindTap Course List)
Algebra
ISBN:
9781305071742
Author:
James Stewart, Lothar Redlin, Saleem Watson
Publisher:
Cengage Learning