The accompanying data represent the miles per gallon of a random sample of cars with a three-cylinder, 1.0 liter engine. (a) Compute the z-score corresponding to the individual who obtained 39.5 miles per gallon. Interpret this result. (b) Determine the quartiles. (c) Compute and interpret the interquartile range, IQR. (d) Determine the lower and upper fences. Are there any outliers? MPG data t this result. 王 32.7 36.0 37.9 38.6 39.9 42.4 eviation(s) V the 42.9 43.7 34.1 36.3 38.0 38.9 40.6 34.3 37.5 38.3 39.5 41.4 35.6 37.7 38.5 39.7 41.8 49.1 Print Done
The accompanying data represent the miles per gallon of a random sample of cars with a three-cylinder, 1.0 liter engine. (a) Compute the z-score corresponding to the individual who obtained 39.5 miles per gallon. Interpret this result. (b) Determine the quartiles. (c) Compute and interpret the interquartile range, IQR. (d) Determine the lower and upper fences. Are there any outliers? MPG data t this result. 王 32.7 36.0 37.9 38.6 39.9 42.4 eviation(s) V the 42.9 43.7 34.1 36.3 38.0 38.9 40.6 34.3 37.5 38.3 39.5 41.4 35.6 37.7 38.5 39.7 41.8 49.1 Print Done

Glencoe Algebra 1, Student Edition, 9780079039897, 0079039898, 2018
18th Edition
ISBN:9780079039897
Author:Carter
Publisher:Carter
Chapter10: Statistics
Section10.3: Measures Of Spread
Problem 1GP

Related questions
Question
Muilty part Statistics question
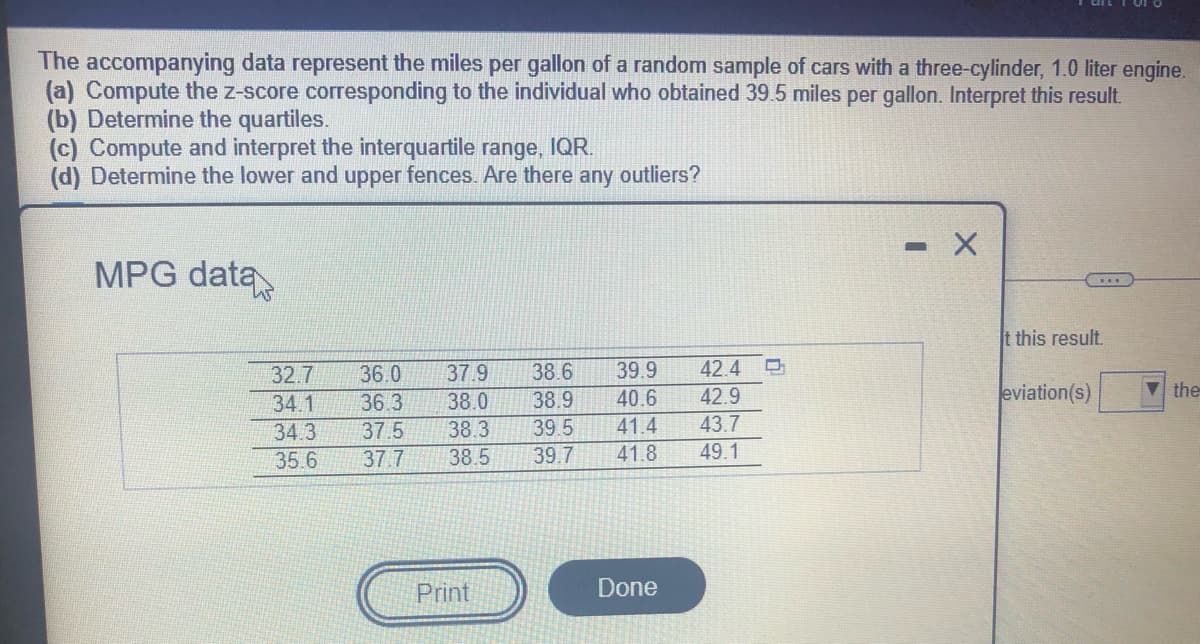
Transcribed Image Text:The accompanying data represent the miles per gallon of a random sample of cars with a three-cylinder, 1.0 liter engine.
(a) Compute the z-score corresponding to the individual who obtained 39.5 miles per gallon. Interpret this result.
(b) Determine the quartiles.
(c) Compute and interpret the interquartile range, IQR.
(d) Determine the lower and upper fences. Are there any outliers?
MPG data
t this result.
32.7
36.0
37.9
38.6
39.9
42.4
38.0
38.9
40.6
42.9
eviation(s)
Vthe
34.1
36.3
34.3
37.5
38.3
39.5
41.4
43.7
35.6
37.7
38.5
39.7
41.8
49.1
Print
Done
Expert Solution
This question has been solved!
Explore an expertly crafted, step-by-step solution for a thorough understanding of key concepts.

This is a popular solution!

Trending now
This is a popular solution!

Step by step
Solved in 3 steps with 3 images

Recommended textbooks for you
Glencoe Algebra 1, Student Edition, 9780079039897…
Algebra
ISBN:
9780079039897
Author:
Carter
Publisher:
McGraw Hill
Glencoe Algebra 1, Student Edition, 9780079039897…
Algebra
ISBN:
9780079039897
Author:
Carter
Publisher:
McGraw Hill