The accompanying data represent the number of days absent, x, and the final exam score, y, for a sample of college students in a general education course at a large state university. Complete parts (a) through (e) below. Click the icon to view the absence count and final exam score data. Click the icon to view a table of critical values for the correlation coefficient. (a) Find the least-squares regression line treating number of absences as the explanatory variable and the final exam score as the response variable. y = -2.777 x + 88.336 (Round to three decimal places as needed.) (b) Interpret the slope and the y-intercept, if appropriate. Choose the correct answer below and fill in any answer boxes in your choice. (Round to three decimal places as needed.) A. For every additional absence, a student's final exam score drops points, on average. It is not appropriate to interpret the y-intercept. B. For every additional absence, a student's final exam score drops 2.777 points, on average. The average final exam score of students who miss no classes is 88.336. C. The average final exam score of students who miss no classes is slope. D. It is not appropriate to interpret the slope or the y-intercept. (c) Predict the final exam score for a student who misses five class periods. y = 74.45 (Round to two decimal places as needed.) Compute the residual. (Round to two decimal places as needed.) It is not appropriate to interpret the
The accompanying data represent the number of days absent, x, and the final exam score, y, for a sample of college students in a general education course at a large state university. Complete parts (a) through (e) below. Click the icon to view the absence count and final exam score data. Click the icon to view a table of critical values for the correlation coefficient. (a) Find the least-squares regression line treating number of absences as the explanatory variable and the final exam score as the response variable. y = -2.777 x + 88.336 (Round to three decimal places as needed.) (b) Interpret the slope and the y-intercept, if appropriate. Choose the correct answer below and fill in any answer boxes in your choice. (Round to three decimal places as needed.) A. For every additional absence, a student's final exam score drops points, on average. It is not appropriate to interpret the y-intercept. B. For every additional absence, a student's final exam score drops 2.777 points, on average. The average final exam score of students who miss no classes is 88.336. C. The average final exam score of students who miss no classes is slope. D. It is not appropriate to interpret the slope or the y-intercept. (c) Predict the final exam score for a student who misses five class periods. y = 74.45 (Round to two decimal places as needed.) Compute the residual. (Round to two decimal places as needed.) It is not appropriate to interpret the

Glencoe Algebra 1, Student Edition, 9780079039897, 0079039898, 2018
18th Edition
ISBN:9780079039897
Author:Carter
Publisher:Carter
Chapter10: Statistics
Section10.4: Distributions Of Data
Problem 19PFA

Related questions
Question

Transcribed Image Text:7:29
The accompanying data represent the number of days absent, x, and the final exam score, y, for a sample of college
students in a general education course at a large state university. Complete parts (a) through (e) below.
Click the icon to view the absence count and final exam score data.
Click the icon to view a table of critical values for the correlation coefficient.
y = -2.777 x + 88.336
(Round to three decimal places as needed.)
(a) Find the least-squares regression line treating number of absences as the explanatory variable and the final exam
score as the response variable.
Vo) 1
LTE2.II 4G .
(b) Interpret the slope and the y-intercept, if appropriate. Choose the correct answer below and fill in any answer
boxes in your choice.
(Round to three decimal places as needed.)
49%
OA. For every additional absence, a student's final exam score drops points, on average. It is not appropriate
to interpret the y-intercept.
OC. The average final exam score of students who miss no classes is
slope.
D. It is not appropriate to interpret the slope or the y-intercept.
(c) Predict the final exam score for a student who misses five class periods.
y = 74.45 (Round to two decimal places as needed.)
Compute the residual.
(Round to two decimal places as needed.)
B. For every additional absence, a student's final exam score drops 2.777 points, on average. The average final
exam score of students who miss no classes is 88.336.
|||
=
O
It is not appropriate to interpret the
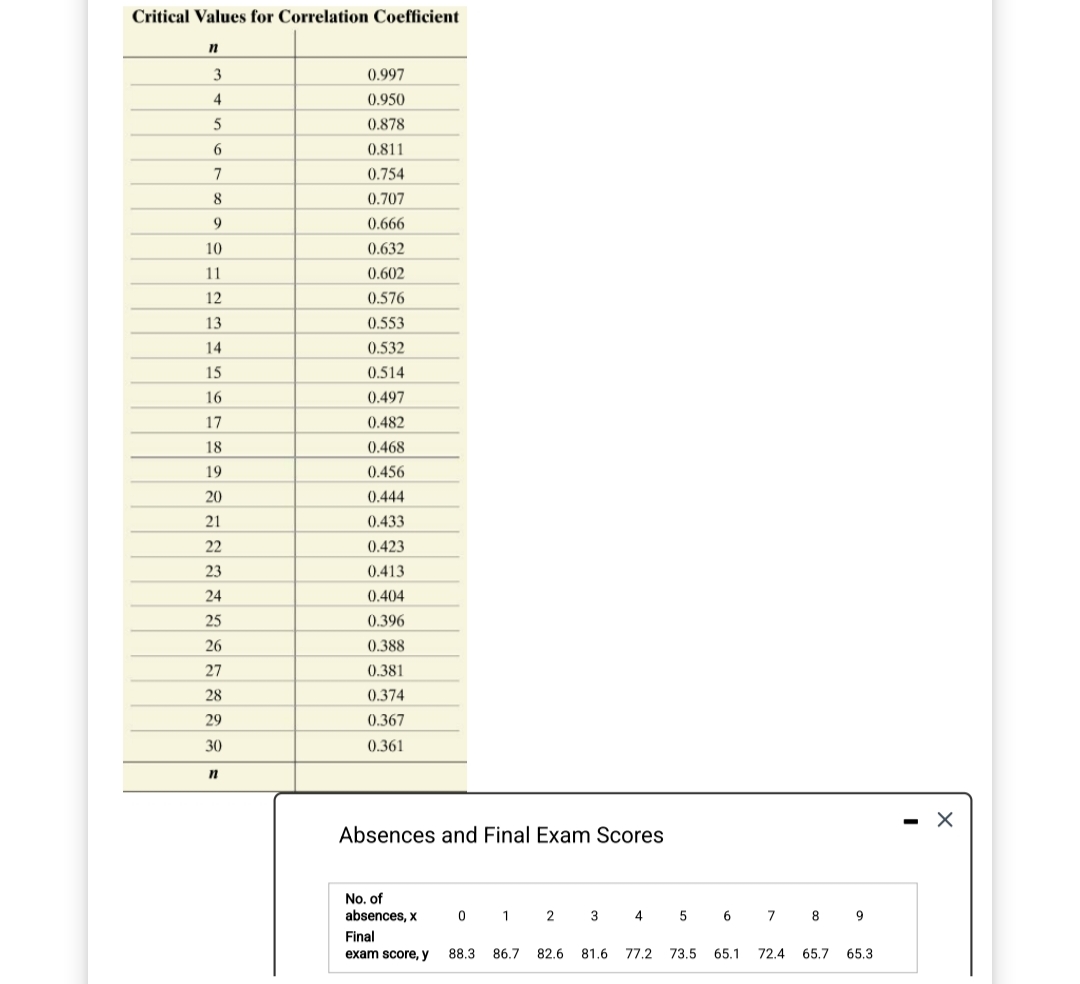
Transcribed Image Text:Critical Values for Correlation Coefficient
n
3
4
5
6
7
8
9
10
11
12
13
14
15
16
17
18
19
20
21
22
23
24
25
26
27
28
29
30
n
0.997
0.950
0.878
0.811
0.754
0.707
0.666
0.632
0.602
0.576
0.553
0.532
0.514
0.497
0.482
0.468
0.456
0.444
0.433
0.423
0.413
0.404
0.396
0.388
0.381
0.374
0.367
0.361
Absences and Final Exam Scores
No. of
absences, x
0 1 2 3 4 5 6 7 8 9
Final
exam score, y 88.3 86.7
82.6 81.6 77.2 73.5
65.1
72.4 65.7 65.3
-
X
Expert Solution
This question has been solved!
Explore an expertly crafted, step-by-step solution for a thorough understanding of key concepts.

This is a popular solution!

Trending now
This is a popular solution!

Step by step
Solved in 3 steps with 3 images

Recommended textbooks for you
Glencoe Algebra 1, Student Edition, 9780079039897…
Algebra
ISBN:
9780079039897
Author:
Carter
Publisher:
McGraw Hill
Glencoe Algebra 1, Student Edition, 9780079039897…
Algebra
ISBN:
9780079039897
Author:
Carter
Publisher:
McGraw Hill