The accompanying data represent the weights (in grams) of a simple random sample of 50 candies. Determine the shape of the distribution of weights of the candies by drawing a frequency histogram. Find the mean and median. Which measure of central tendency better describes the weight of the candy? Click the icon to view the weights of the candy. Choose the correct histogram below. OA. Frequency A 16- 12- 8- 4- 0- 0.8 0.9 Weight (grams) Q Q OB. Frequency 16+ 12- 8- 4- 0- 0.8 0.9 Weight (grams) Candy Weights 1 Q Q O C. Frequency 16- 12- 8- Candy Weights (in grams) 9 0.91 0.88 0.88 0.92 0.92 0.88 0.83 0.87 0.94 0.81 0.86 0.89 0.83 0.88 0.81 0.85 0.93 0.87 0.88 0.90 0.84 0.79 0.88 0.87 0.84 0.87 0.83 0.83 0.87 0.92 0.88 0.88 0.90 0.86 0.91 0.84 0.85 0.92 0.87 0.87 0.87 0.89 0.89 0.96 088082 091 094 0.86 0.87 0.8 0.9 Weight (grams) 1 Q — Q - X O D. requency A 16- 12- 8- 4- 0- 0.8 0.9 Weight (grams)
The accompanying data represent the weights (in grams) of a simple random sample of 50 candies. Determine the shape of the distribution of weights of the candies by drawing a frequency histogram. Find the mean and median. Which measure of central tendency better describes the weight of the candy? Click the icon to view the weights of the candy. Choose the correct histogram below. OA. Frequency A 16- 12- 8- 4- 0- 0.8 0.9 Weight (grams) Q Q OB. Frequency 16+ 12- 8- 4- 0- 0.8 0.9 Weight (grams) Candy Weights 1 Q Q O C. Frequency 16- 12- 8- Candy Weights (in grams) 9 0.91 0.88 0.88 0.92 0.92 0.88 0.83 0.87 0.94 0.81 0.86 0.89 0.83 0.88 0.81 0.85 0.93 0.87 0.88 0.90 0.84 0.79 0.88 0.87 0.84 0.87 0.83 0.83 0.87 0.92 0.88 0.88 0.90 0.86 0.91 0.84 0.85 0.92 0.87 0.87 0.87 0.89 0.89 0.96 088082 091 094 0.86 0.87 0.8 0.9 Weight (grams) 1 Q — Q - X O D. requency A 16- 12- 8- 4- 0- 0.8 0.9 Weight (grams)

Glencoe Algebra 1, Student Edition, 9780079039897, 0079039898, 2018
18th Edition
ISBN:9780079039897
Author:Carter
Publisher:Carter
Chapter10: Statistics
Section10.6: Summarizing Categorical Data
Problem 42PFA

Related questions
Question
How do you solve?
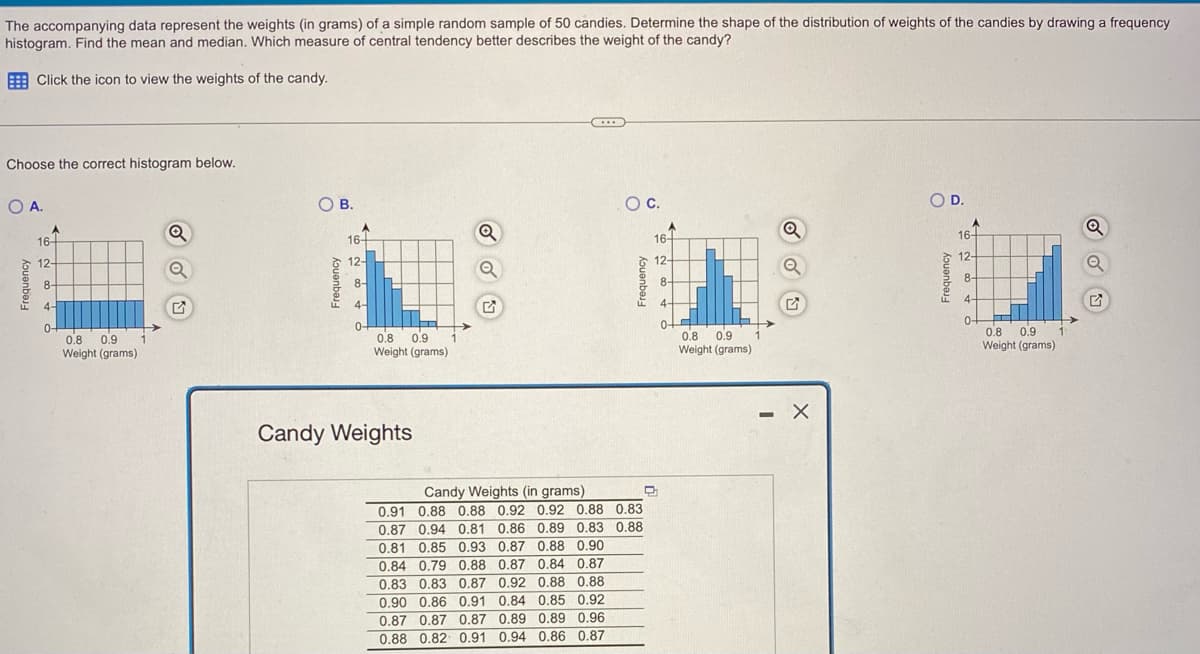
Transcribed Image Text:The accompanying data represent the weights (in grams) of a simple random sample of 50 candies. Determine the shape of the distribution of weights of the candies by drawing a frequency
histogram. Find the mean and median. Which measure of central tendency better describes the weight of the candy?
Click the icon to view the weights of the candy.
Choose the correct histogram below.
O A.
Kouenbe
16-
12-
8-
0-
0.8 0.9
Weight (grams)
Q
O B.
Frequency
16-
12-
8-
4-
0-
0.9 1
0.8
Weight (grams)
Candy Weights
Q
Q
O C.
Frequency
A
16+
12-
Candy Weights (in grams)
D
0.91 0.88 0.88 0.92 0.92 0.88 0.83
0.87 0.94 0.81 0.86 0.89 0.83 0.88
0.81 0.85 0.93 0.87 0.88 0.90
0.84 0.79 0.88 0.87 0.84 0.87
0.83 0.83 0.87 0.92 0.88 0.88
0.90 0.86 0.91 0.84 0.85 0.92
0.87 0.87 0.87 0.89 0.89 0.96
0.88 0.82 0.91 0.94 0.86 0.87
·
0-
0.8 0.9 1
Weight (grams)
Q
Q
- X
OD.
requency
< + + + +
16-
12-
8-
4-
0-
0.8 0.9
Weight (grams)
1
Q
Expert Solution
This question has been solved!
Explore an expertly crafted, step-by-step solution for a thorough understanding of key concepts.

This is a popular solution!

Trending now
This is a popular solution!

Step by step
Solved in 4 steps with 1 images

Recommended textbooks for you
Glencoe Algebra 1, Student Edition, 9780079039897…
Algebra
ISBN:
9780079039897
Author:
Carter
Publisher:
McGraw Hill


Big Ideas Math A Bridge To Success Algebra 1: Stu…
Algebra
ISBN:
9781680331141
Author:
HOUGHTON MIFFLIN HARCOURT
Publisher:
Houghton Mifflin Harcourt
Glencoe Algebra 1, Student Edition, 9780079039897…
Algebra
ISBN:
9780079039897
Author:
Carter
Publisher:
McGraw Hill
Big Ideas Math A Bridge To Success Algebra 1: Stu…
Algebra
ISBN:
9781680331141
Author:
HOUGHTON MIFFLIN HARCOURT
Publisher:
Houghton Mifflin Harcourt