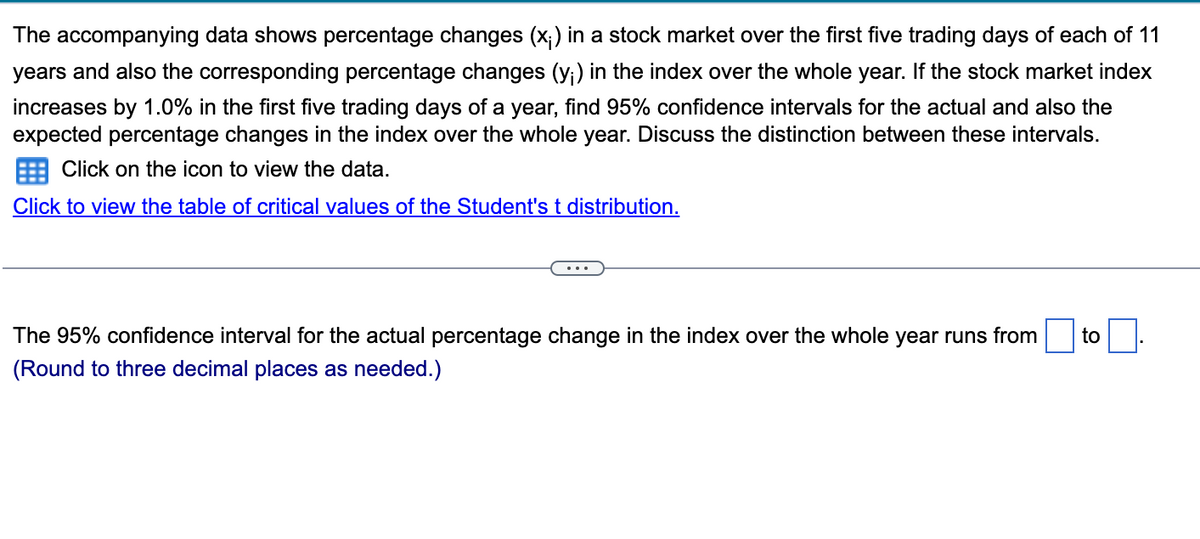
The accompanying data shows percentage changes (x;) in a stock market over the first five trading days of each of 11 years and also the corresponding percentage changes (y;) in the index over the whole year. If the stock market index increases by 1.0% in the first five trading days of a year, find 95% confidence intervals for the actual and also the expected percentage changes in the index over the whole year. Discuss the distinction between these intervals. Click on the icon to view the data. Click to view the table of critical values of the Student's t distribution. The 95% confidence interval for the actual percentage change in the index over the whole year runs from to (Round to three decimal places as needed.)
The accompanying data shows percentage changes (x;) in a stock market over the first five trading days of each of 11 years and also the corresponding percentage changes (y;) in the index over the whole year. If the stock market index increases by 1.0% in the first five trading days of a year, find 95% confidence intervals for the actual and also the expected percentage changes in the index over the whole year. Discuss the distinction between these intervals. Click on the icon to view the data. Click to view the table of critical values of the Student's t distribution. The 95% confidence interval for the actual percentage change in the index over the whole year runs from to (Round to three decimal places as needed.)

MATLAB: An Introduction with Applications
6th Edition
ISBN:9781119256830
Author:Amos Gilat
Publisher:Amos Gilat
Chapter1: Starting With Matlab
Section: Chapter Questions
Problem 1P

Related questions
Question
Year Change_Over_Five_Days Change_For_Entire_Year
1 0.2 -0.2
2 0.2 -0.1
3 0.2 1.8
4 -0.4 1.2
5 -0.1 -0.3
6 0.2 -0.6
7 -0.1 0.8
8 -0.9 1.8
9 0.2 -0.7
10 0.1 -1.0
11 0.2 -1.0
Transcribed Image Text:The accompanying data shows percentage changes (x;) in a stock market over the first five trading days of each of 11
years and also the corresponding percentage changes (y₁) in the index over the whole year. If the stock market index
increases by 1.0% in the first five trading days of a year, find 95% confidence intervals for the actual and also the
expected percentage changes in the index over the whole year. Discuss the distinction between these intervals.
Click on the icon to view the data.
Click to view the table of critical values of the Student's t distribution.
The 95% confidence interval for the actual percentage change in the index over the whole year runs from to
(Round to three decimal places as needed.)
Expert Solution
This question has been solved!
Explore an expertly crafted, step-by-step solution for a thorough understanding of key concepts.

This is a popular solution!

Trending now
This is a popular solution!

Step by step
Solved in 3 steps with 3 images

Recommended textbooks for you
MATLAB: An Introduction with Applications
Statistics
ISBN:
9781119256830
Author:
Amos Gilat
Publisher:
John Wiley & Sons Inc

Probability and Statistics for Engineering and th…
Statistics
ISBN:
9781305251809
Author:
Jay L. Devore
Publisher:
Cengage Learning

Statistics for The Behavioral Sciences (MindTap C…
Statistics
ISBN:
9781305504912
Author:
Frederick J Gravetter, Larry B. Wallnau
Publisher:
Cengage Learning
MATLAB: An Introduction with Applications
Statistics
ISBN:
9781119256830
Author:
Amos Gilat
Publisher:
John Wiley & Sons Inc
Probability and Statistics for Engineering and th…
Statistics
ISBN:
9781305251809
Author:
Jay L. Devore
Publisher:
Cengage Learning
Statistics for The Behavioral Sciences (MindTap C…
Statistics
ISBN:
9781305504912
Author:
Frederick J Gravetter, Larry B. Wallnau
Publisher:
Cengage Learning

Elementary Statistics: Picturing the World (7th E…
Statistics
ISBN:
9780134683416
Author:
Ron Larson, Betsy Farber
Publisher:
PEARSON

The Basic Practice of Statistics
Statistics
ISBN:
9781319042578
Author:
David S. Moore, William I. Notz, Michael A. Fligner
Publisher:
W. H. Freeman

Introduction to the Practice of Statistics
Statistics
ISBN:
9781319013387
Author:
David S. Moore, George P. McCabe, Bruce A. Craig
Publisher:
W. H. Freeman