The accompanying graph displays an Aggregate Demand (AD), Aggregate Supply (AS), and Potential GDP curve. Please illustrate how stagflation can occur in this economy. Potential GDP AS AD Price Level
The accompanying graph displays an Aggregate Demand (AD), Aggregate Supply (AS), and Potential GDP curve. Please illustrate how stagflation can occur in this economy. Potential GDP AS AD Price Level

Chapter8: Macroeconomic Equilibrium: Aggregate Demand And Supply
Section: Chapter Questions
Problem 18E

Related questions
Question
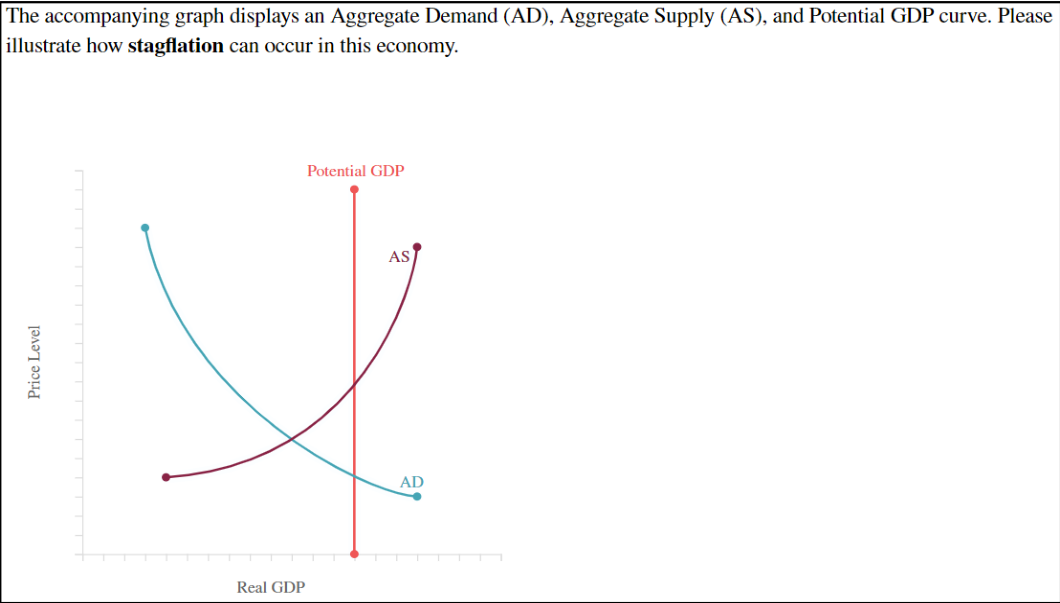
Transcribed Image Text:The accompanying graph displays an Aggregate Demand (AD), Aggregate Supply (AS), and Potential GDP curve. Please
illustrate how stagflation can occur in this economy.
Potential GDP
AS
AD
Real GDP
Price Level
Expert Solution
This question has been solved!
Explore an expertly crafted, step-by-step solution for a thorough understanding of key concepts.

This is a popular solution!

Trending now
This is a popular solution!

Step by step
Solved in 2 steps with 1 images

Knowledge Booster


Learn more about
Need a deep-dive on the concept behind this application? Look no further. Learn more about this topic, economics and related others by exploring similar questions and additional content below.Recommended textbooks for you


Exploring Economics
Economics
ISBN:
9781544336329
Author:
Robert L. Sexton
Publisher:
SAGE Publications, Inc
Exploring Economics
Economics
ISBN:
9781544336329
Author:
Robert L. Sexton
Publisher:
SAGE Publications, Inc

Economics (MindTap Course List)
Economics
ISBN:
9781337617383
Author:
Roger A. Arnold
Publisher:
Cengage Learning
