The accompanying table gives the results of a survey of 23 patients at a hospital, with 95% confidence intervals. Construct a stock chart-based visualization of these confidence intervals. What conclusions can you draw from the chart?
The accompanying table gives the results of a survey of 23 patients at a hospital, with 95% confidence intervals. Construct a stock chart-based visualization of these confidence intervals. What conclusions can you draw from the chart?

MATLAB: An Introduction with Applications
6th Edition
ISBN:9781119256830
Author:Amos Gilat
Publisher:Amos Gilat
Chapter1: Starting With Matlab
Section: Chapter Questions
Problem 1P

Related questions
Question
1. What conclusions can you draw about the proportions of Satisfaction with Quality of Care from Nurses and Satisfaction with Quality of Care from Specialists from the chart?
The confidence intervals overlap, so we can conclude that the proportions are significantly different.
The confidence intervals do not overlap, so we can conclude that the proportions are significantly different.
The confidence intervals do not overlap, so we cannot conclude that the proportions are significantly different.
The confidence intervals overlap, so we cannot conclude that the proportions are significantly different.
2. What conclusions can you draw about the proportions of the Satisfaction with Quality of Care from Nurses and Satisfaction with Quality of Care from Practitioners from the chart?
The confidence intervals do not overlap, so we cannot conclude that the proportions are significantly different.
The confidence intervals do not overlap, so we can conclude that the proportions are significantly different.
The confidence intervals overlap, so we can conclude that the proportions are significantly different.
The confidence intervals overlap, so we cannot conclude that the proportions are significantly different.
3. What conclusions can you draw about the proportions of the Satisfaction with Quality of Care from Specialists and Satisfaction with Quality of Care from Practitioners from the chart?
The confidence intervals overlap, so we can conclude that the proportions are significantly different.
The confidence intervals do not overlap, so we can conclude that the proportions are significantly different.
The confidence intervals overlap, so we cannot conclude that the proportions are significantly different.
The confidence intervals do not overlap, so we cannot conclude that the proportions are significantly different.
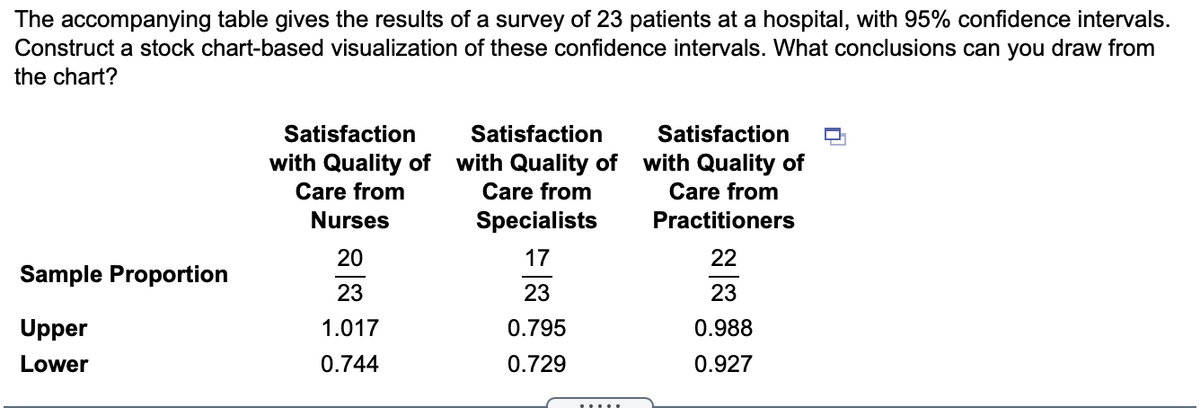
Transcribed Image Text:The accompanying table gives the results of a survey of 23 patients at a hospital, with 95% confidence intervals.
Construct a stock chart-based visualization of these confidence intervals. What conclusions can you draw from
the chart?
Satisfaction
Satisfaction
Satisfaction
with Quality of with Quality of
with Quality of
Care from
Care from
Care from
Nurses
Specialists
Practitioners
20
17
22
Sample Proportion
23
23
23
Upper
1.017
0.795
0.988
Lower
0.744
0.729
0.927
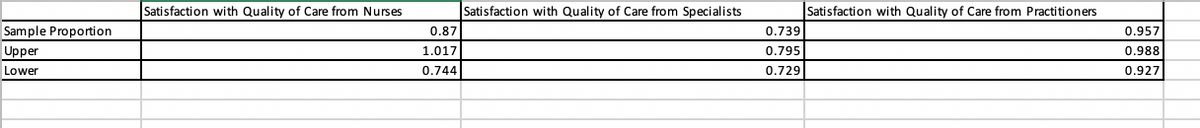
Transcribed Image Text:Satisfaction with Quality of Care from Nurses
Satisfaction with Quality of Care from Specialists
Satisfaction with Quality of Care from Practitioners
Sample Proportion
0.87
0.739
0.957
Upper
1.017
0.795
0.988
Lower
0.744
0.729
0.927
Expert Solution
This question has been solved!
Explore an expertly crafted, step-by-step solution for a thorough understanding of key concepts.

This is a popular solution!

Trending now
This is a popular solution!

Step by step
Solved in 2 steps

Recommended textbooks for you
MATLAB: An Introduction with Applications
Statistics
ISBN:
9781119256830
Author:
Amos Gilat
Publisher:
John Wiley & Sons Inc

Probability and Statistics for Engineering and th…
Statistics
ISBN:
9781305251809
Author:
Jay L. Devore
Publisher:
Cengage Learning

Statistics for The Behavioral Sciences (MindTap C…
Statistics
ISBN:
9781305504912
Author:
Frederick J Gravetter, Larry B. Wallnau
Publisher:
Cengage Learning
MATLAB: An Introduction with Applications
Statistics
ISBN:
9781119256830
Author:
Amos Gilat
Publisher:
John Wiley & Sons Inc
Probability and Statistics for Engineering and th…
Statistics
ISBN:
9781305251809
Author:
Jay L. Devore
Publisher:
Cengage Learning
Statistics for The Behavioral Sciences (MindTap C…
Statistics
ISBN:
9781305504912
Author:
Frederick J Gravetter, Larry B. Wallnau
Publisher:
Cengage Learning

Elementary Statistics: Picturing the World (7th E…
Statistics
ISBN:
9780134683416
Author:
Ron Larson, Betsy Farber
Publisher:
PEARSON

The Basic Practice of Statistics
Statistics
ISBN:
9781319042578
Author:
David S. Moore, William I. Notz, Michael A. Fligner
Publisher:
W. H. Freeman

Introduction to the Practice of Statistics
Statistics
ISBN:
9781319013387
Author:
David S. Moore, George P. McCabe, Bruce A. Craig
Publisher:
W. H. Freeman