The accompanying table gives the stock market indices for a certain company on the stock market. Use simple linear regression to forecast the data. What would be the forecasts for the next three days? Click the icon to view the stock market indices for the company on the stock market Select the graph that shows the correct trendline forecast for the given data. O Click here to view the graph d. Click here to view the graph b. Click here to view the graph a O Click here to view the graph c What would be the forecast for the next three days? (Round to two decimal places as needed.) Date Index 10/2/2010 10/3/2010 10/4/2010 thi 000
The accompanying table gives the stock market indices for a certain company on the stock market. Use simple linear regression to forecast the data. What would be the forecasts for the next three days? Click the icon to view the stock market indices for the company on the stock market Select the graph that shows the correct trendline forecast for the given data. O Click here to view the graph d. Click here to view the graph b. Click here to view the graph a O Click here to view the graph c What would be the forecast for the next three days? (Round to two decimal places as needed.) Date Index 10/2/2010 10/3/2010 10/4/2010 thi 000

Glencoe Algebra 1, Student Edition, 9780079039897, 0079039898, 2018
18th Edition
ISBN:9780079039897
Author:Carter
Publisher:Carter
Chapter4: Equations Of Linear Functions
Section4.6: Regression And Median-fit Lines
Problem 22PFA

Related questions
Question
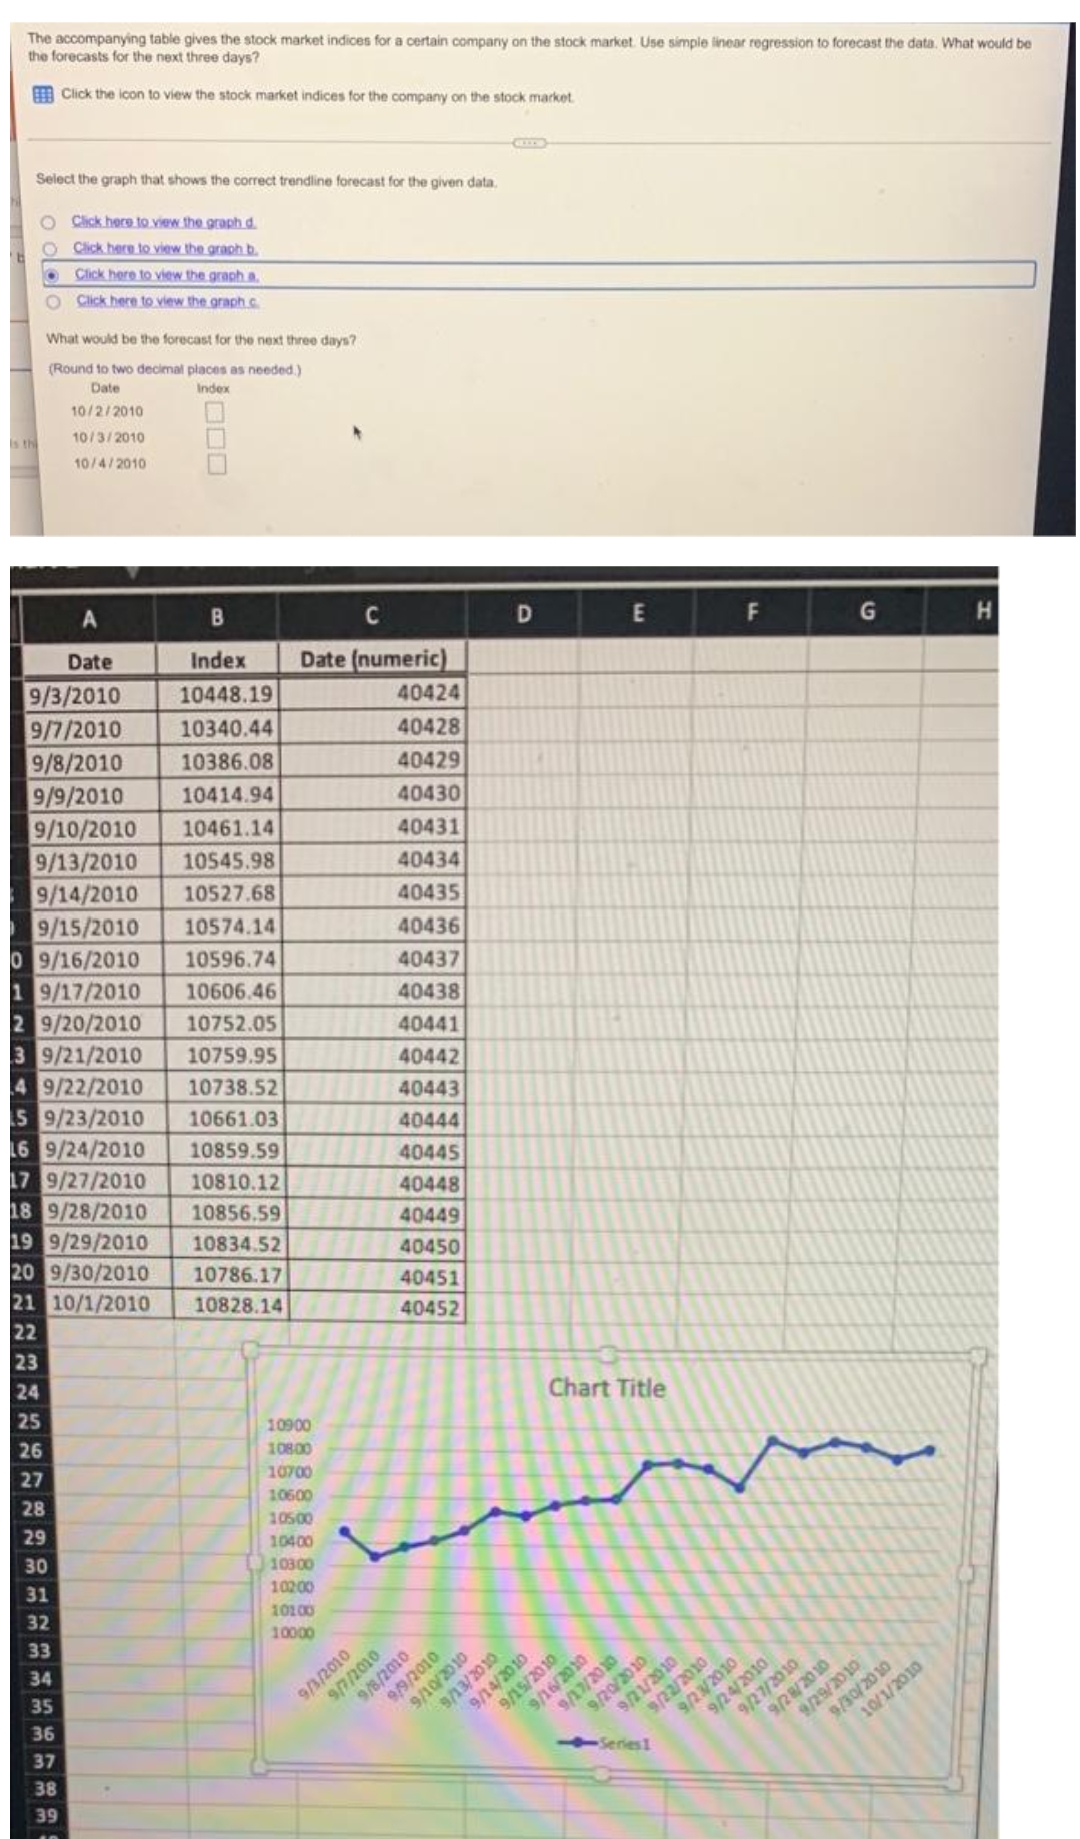
Transcribed Image Text:The accompanying table gives the stock market indices for a certain company on the stock market. Use simple linear regression to forecast the data. What would be
the forecasts for the next three days?
Click the icon to view the stock market indices for the company on the stock market.
Select the graph that shows the correct trendline forecast for the given data.
O Click here to view the graph d.
O
Click here to view the graph b.
•
Click here to view the graph a.
O
Click here to view the graph c
What would be the forecast for the next three days?
(Round to two decimal places as needed.)
Index
Date
10/2/2010
10/3/2010
10/4/2010
B
F
G
A
H
Date
Index
9/3/2010
10448.19
9/7/2010
10340.44
9/8/2010 10386.08
9/9/2010 10414.94
9/10/2010 10461.14
9/13/2010 10545.98
9/14/2010 10527.68
9/15/2010 10574.14
0 9/16/2010
10596.74
1 9/17/2010
10606.46
2 9/20/2010 10752.05
3 9/21/2010 10759.95
4 9/22/2010 10738.52
5 9/23/2010 10661.03
16 9/24/2010 10859.59
17 9/27/2010 10810.12
18 9/28/2010 10856.59
19 9/29/2010 10834.52
20 9/30/2010 10786.17
21 10/1/2010 10828.14
22
23
24
25
26
27
28
29
30
31
32
33
34
35
36
37
38
39
B
is the
C
Date (numeric)
40424
40428
40429
40430
40431
40434
40435
40436
40437
40438
40441
40442
40443
40444
40445
40448
40449
40450
40451
40452
10900
108:00
10700
10600
105:00
10400
10300
10200
10100
10000
0102/1/6
9/7/2010
9/8/2010
otot/6/6
9/10/2010
9/13/2010
D
9/14/2010
E
Chart Title
9/15/2010
9/16/2010
9/17/2010
9/20/2010
9/21/2010
9/22/2010
9/23/2010
Series1
9/24/2010
9/27/2010
9/28/2010
9/29/2010
10/1/2010
9/30/2010
Expert Solution
This question has been solved!
Explore an expertly crafted, step-by-step solution for a thorough understanding of key concepts.

This is a popular solution!

Trending now
This is a popular solution!

Step by step
Solved in 2 steps with 10 images

Recommended textbooks for you
Glencoe Algebra 1, Student Edition, 9780079039897…
Algebra
ISBN:
9780079039897
Author:
Carter
Publisher:
McGraw Hill


Algebra and Trigonometry (MindTap Course List)
Algebra
ISBN:
9781305071742
Author:
James Stewart, Lothar Redlin, Saleem Watson
Publisher:
Cengage Learning
Glencoe Algebra 1, Student Edition, 9780079039897…
Algebra
ISBN:
9780079039897
Author:
Carter
Publisher:
McGraw Hill
Algebra and Trigonometry (MindTap Course List)
Algebra
ISBN:
9781305071742
Author:
James Stewart, Lothar Redlin, Saleem Watson
Publisher:
Cengage Learning


Functions and Change: A Modeling Approach to Coll…
Algebra
ISBN:
9781337111348
Author:
Bruce Crauder, Benny Evans, Alan Noell
Publisher:
Cengage Learning

Trigonometry (MindTap Course List)
Trigonometry
ISBN:
9781305652224
Author:
Charles P. McKeague, Mark D. Turner
Publisher:
Cengage Learning