The data to the right represent the top speed (in kilometers per hour) of all the players (except goaltenders) in a certain soccer league Construct (a) a relative frequency distribution (b) a frequency histogram, and (c) a relative frequency histogram. What percentage of players had a top speed between 26 and 29.9 km/h? What percentage of players had a top speed less than 13.9 km/h? (a) Construct a relative frequency distribution. Speed (km/hr) Relative Frequency 10-13.9 14-17.9 18-21.9 22-25.9 26-29.9 30-33.9 (Round to four decimal places as needed) Speed (km/hr) Number of Players 10-13.9 14-17.9 5 18-21.9 22-25.9 26-29.9 30-33.9 8 20 69 302 194
The data to the right represent the top speed (in kilometers per hour) of all the players (except goaltenders) in a certain soccer league Construct (a) a relative frequency distribution (b) a frequency histogram, and (c) a relative frequency histogram. What percentage of players had a top speed between 26 and 29.9 km/h? What percentage of players had a top speed less than 13.9 km/h? (a) Construct a relative frequency distribution. Speed (km/hr) Relative Frequency 10-13.9 14-17.9 18-21.9 22-25.9 26-29.9 30-33.9 (Round to four decimal places as needed) Speed (km/hr) Number of Players 10-13.9 14-17.9 5 18-21.9 22-25.9 26-29.9 30-33.9 8 20 69 302 194

Glencoe Algebra 1, Student Edition, 9780079039897, 0079039898, 2018
18th Edition
ISBN:9780079039897
Author:Carter
Publisher:Carter
Chapter10: Statistics
Section10.6: Summarizing Categorical Data
Problem 23PPS

Related questions
Question
Transcribed Image Text:search
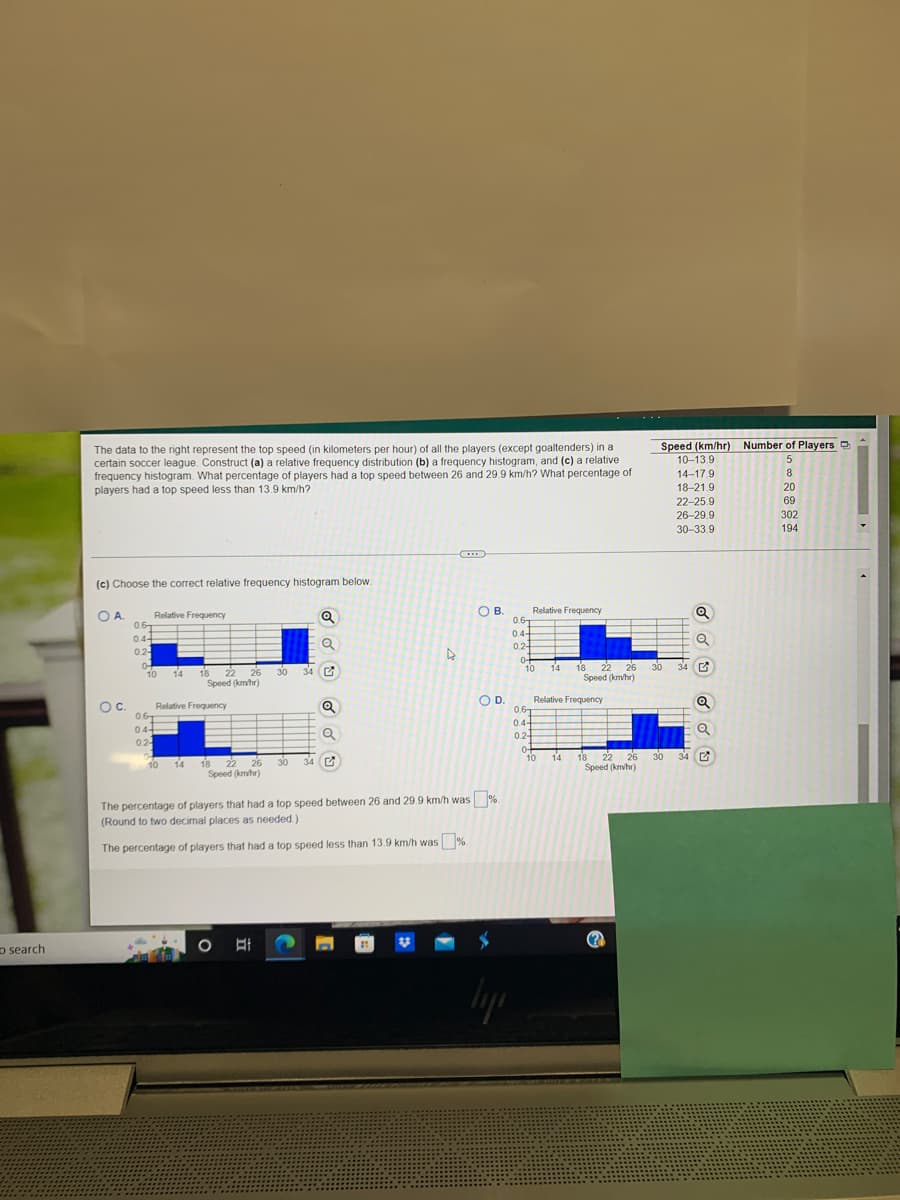
The data to the right represent the top speed (in kilometers per hour) of all the players (except goaltenders) in a
certain soccer league. Construct (a) a relative frequency distribution (b) a frequency histogram, and (c) a relative
frequency histogram. What percentage of players had a top speed between 26 and 29.9 km/h? What percentage of
players had a top speed less than 13.9 km/h?
C...
(c) Choose the correct relative frequency histogram below.
OA.
Relative Frequency
Q
Relative Frequency
0.6T
0.4-
H
Q
0.2
30
0.6
0.4+
0.2-
0
0
O C.
10 14
34
0.6
0.4+
02-
▷
Q
Q
OB.
18 22 26
Speed (km/hr)
Relative Frequency
10
14
10
18 22 26 30 34
Speed (km/hr)
The percentage of players that had a top speed between 26 and 29.9 km/h was %.
(Round to two decimal places as needed.)
The percentage of players that had a top speed less than 13.9 km/h was%.
○바
O
D.
04
10
lys
0.6
0.4-
0.2-
04
14 18 22
22 26
Speed (km/hr)
18 22 26
Speed (km/hr)
Relative Frequency
14
Speed (km/hr) Number of Players
10-13.9
5
14-17.9
8
18-21.9
20
69
22-25.9
26-29.9
30-33.9
302
194
30
34
30 34
dd dd U
Transcribed Image Text:here to search
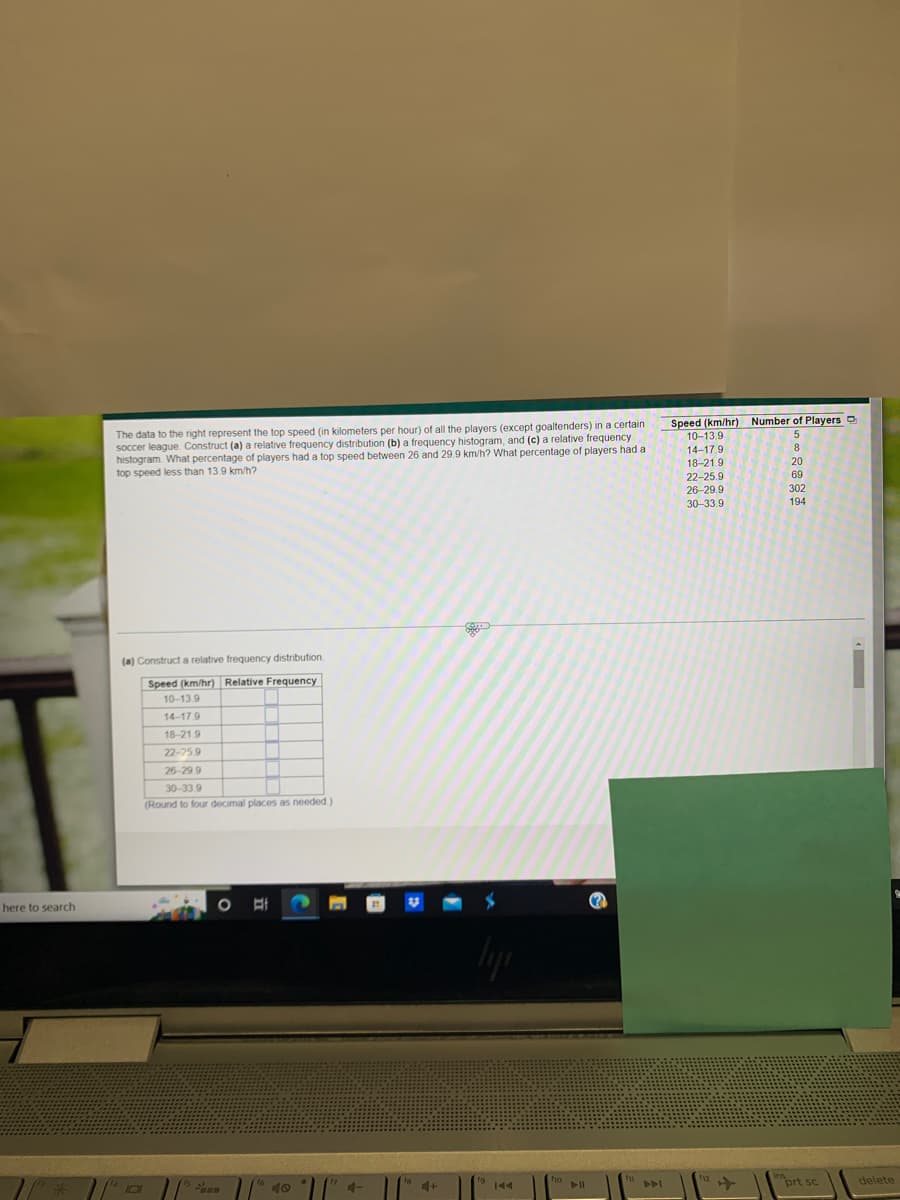
The data to the right represent the top speed (in kilometers per hour) of all the players (except goaltenders) in a certain
soccer league. Construct (a) a relative frequency distribution (b) a frequency histogram, and (c) a relative frequency
histogram. What percentage of players had a top speed between 26 and 29.9 km/h? What percentage of players had a
top speed less than 13.9 km/h?
(a) Construct a relative frequency distribution.
Speed (km/hr) Relative Frequency
10-13.9
14-17.9
18-21.9
22-25.9
26-29.9
30-33.9
(Round to four decimal places as needed.)
11
10
40
4-
4+
144
Speed (km/hr) Number of Players D
10-13.9
14-17.9
8
18-21.9
20
22-25.9
69
26-29.9
302
30-33.9
194
prt sc
▸
delete
Expert Solution
This question has been solved!
Explore an expertly crafted, step-by-step solution for a thorough understanding of key concepts.

This is a popular solution!

Trending now
This is a popular solution!

Step by step
Solved in 5 steps with 4 images

Recommended textbooks for you
Glencoe Algebra 1, Student Edition, 9780079039897…
Algebra
ISBN:
9780079039897
Author:
Carter
Publisher:
McGraw Hill
Glencoe Algebra 1, Student Edition, 9780079039897…
Algebra
ISBN:
9780079039897
Author:
Carter
Publisher:
McGraw Hill