The accompanying table lists pulse rates. Use a 0.05 significance level and apply the methods of two-way analysis of variance. What is the conclusion? State the null and alternative hypotheses in the test for the effect of an interaction between row and column factors. interaction between gender and age. interaction between gender and age. Ho: There H₁: There OB. Ho: The row values are from populations with the same standard deviation. H₁: At least one of the rows is sampled from a population with a standard deviation different from the others. What is the value of the test statistic for this test? F = (Round to two decimal places as needed.) What is the corresponding P-value of the test statistic, F, for this test? P-value = (Round to three decimal places as needed.) State the conclusion of this test. Ho. There sufficient evidence to warrant rejection of the claim that pulse rates are not affected by an interaction between gender and age. There State the null and alternative hypotheses in the test for the effect from the row factor. OA. Ho: The row values are from populations with the same mean. H₁: At least one of the rows is sampled from a population with a mean different from the others. OC. Ho: At least one of the rows is sampled from a population with a mean different from the others. H₁: The row values are from populations with the same mean. OD. In this case, the test for the effect from a row factor should not be done. What is the value of the test statistic for this test? OA. F= (Round to two decimal places as needed.) OB. In this case, the test for the effect from a row factor should not be done. What is the corresponding P-value of the test statistic, F, for this test? Pulse Rates for Gender and Age OA. P-value (Round to three decimal places as needed.) OB. In this case, the test for the effect from a row factor should not be done. Under 30 Years of Age Over 30 Years of Age Female 79 103 79 65 59 98 82 98 90 96 76 76 71 65 72 79 63 73 75 57 Female Male 59 79 56 69 68 74 74 69 61 56 46 69 61 65 90 79 59 58 64 60 Male Print Done appear to be an effect from an interaction between gender and age. X
The accompanying table lists pulse rates. Use a 0.05 significance level and apply the methods of two-way analysis of variance. What is the conclusion? State the null and alternative hypotheses in the test for the effect of an interaction between row and column factors. interaction between gender and age. interaction between gender and age. Ho: There H₁: There OB. Ho: The row values are from populations with the same standard deviation. H₁: At least one of the rows is sampled from a population with a standard deviation different from the others. What is the value of the test statistic for this test? F = (Round to two decimal places as needed.) What is the corresponding P-value of the test statistic, F, for this test? P-value = (Round to three decimal places as needed.) State the conclusion of this test. Ho. There sufficient evidence to warrant rejection of the claim that pulse rates are not affected by an interaction between gender and age. There State the null and alternative hypotheses in the test for the effect from the row factor. OA. Ho: The row values are from populations with the same mean. H₁: At least one of the rows is sampled from a population with a mean different from the others. OC. Ho: At least one of the rows is sampled from a population with a mean different from the others. H₁: The row values are from populations with the same mean. OD. In this case, the test for the effect from a row factor should not be done. What is the value of the test statistic for this test? OA. F= (Round to two decimal places as needed.) OB. In this case, the test for the effect from a row factor should not be done. What is the corresponding P-value of the test statistic, F, for this test? Pulse Rates for Gender and Age OA. P-value (Round to three decimal places as needed.) OB. In this case, the test for the effect from a row factor should not be done. Under 30 Years of Age Over 30 Years of Age Female 79 103 79 65 59 98 82 98 90 96 76 76 71 65 72 79 63 73 75 57 Female Male 59 79 56 69 68 74 74 69 61 56 46 69 61 65 90 79 59 58 64 60 Male Print Done appear to be an effect from an interaction between gender and age. X

MATLAB: An Introduction with Applications
6th Edition
ISBN:9781119256830
Author:Amos Gilat
Publisher:Amos Gilat
Chapter1: Starting With Matlab
Section: Chapter Questions
Problem 1P

Related questions
Question
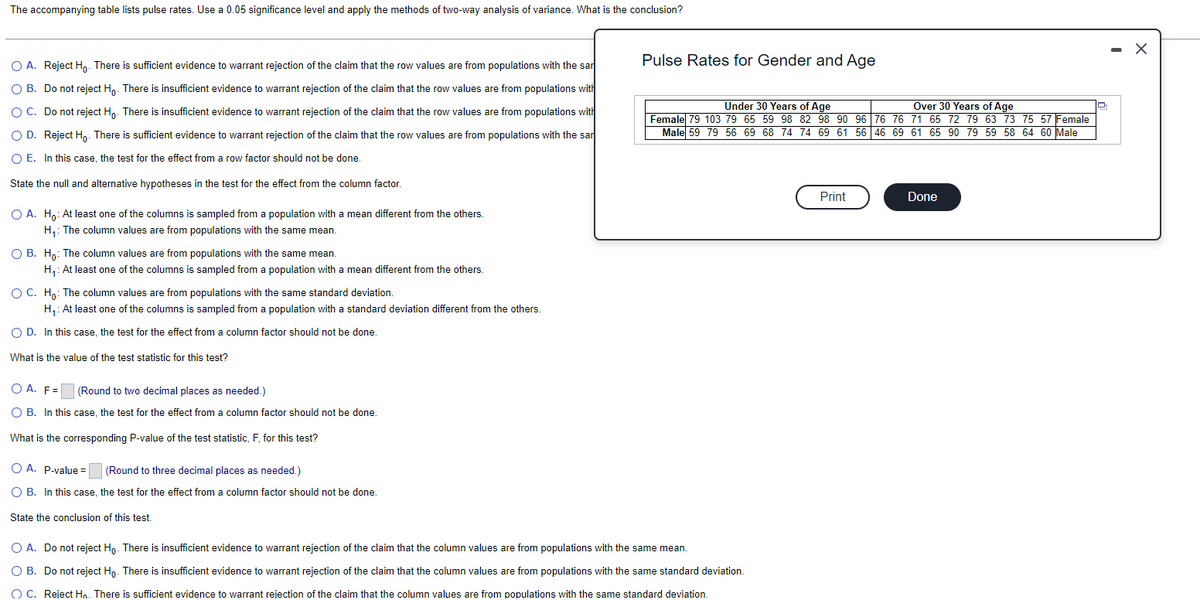
Transcribed Image Text:The accompanying table lists pulse rates. Use a 0.05 significance level and apply the methods of two-way analysis of variance. What is the conclusion?
O A. Reject Ho. There is sufficient evidence to warrant rejection of the claim that the row values are from populations with the sar
O B. Do not reject Ho. There is insufficient evidence to warrant rejection of the claim that the row values are from populations with
O C. Do not reject Ho. There is insufficient evidence to warrant rejection of the claim that the row values are from populations with
O D. Reject Ho. There is sufficient evidence to warrant rejection of the claim that the row values are from populations with the sar
O E. In this case, the test for the effect from a row factor should not be done.
State the null and alternative hypotheses in the test for the effect from the column factor.
O A. Ho: At least one of the columns is sampled from a population with a mean different from the others.
H₁: The column values are from populations with the same mean.
O B. Ho: The column values are from populations with the same mean.
H₁: At least one of the columns is sampled from a population with a mean different from the others.
O C. Ho: The column values are from populations with the same standard deviation.
H₁: At least one of the columns is sampled from a population with a standard deviation different from the others.
O D.
In this case, the test for the effect from a column factor should not be done.
What is the value of the test statistic for this test?
O A. F=
(Round to two decimal places as needed.)
O B. In this case, the test for the effect from a column factor should not be done.
What is the corresponding P-value of the test statistic, F, for this test?
OA. P-value=
(Round to three decimal places as needed.)
O B. In this case, the test for the effect from a column factor should not be done.
State the conclusion of this test.
Pulse Rates for Gender and Age
Under 30 Years of Age
Over 30 Years of Age
Female 79 103 79 65 59 98 82 98 90 96 76 76 71 65 72 79 63 73 75 57 Female
Male 59 79 56 69 68 74 74 69 61 56 46 69 61 65 90 79 59 58 64 60 Male
O A. Do not reject Ho. There is insufficient evidence to warrant rejection of the claim that the column values are from populations with the same mean.
O B. Do not reject Ho. There is insufficient evidence to warrant rejection of the claim that the column values are from populations with the same standard deviation.
O C. Reject Hn. There is sufficient evidence to warrant rejection of the claim that the column values are from populations with the same standard deviation.
Print
Done
-
X
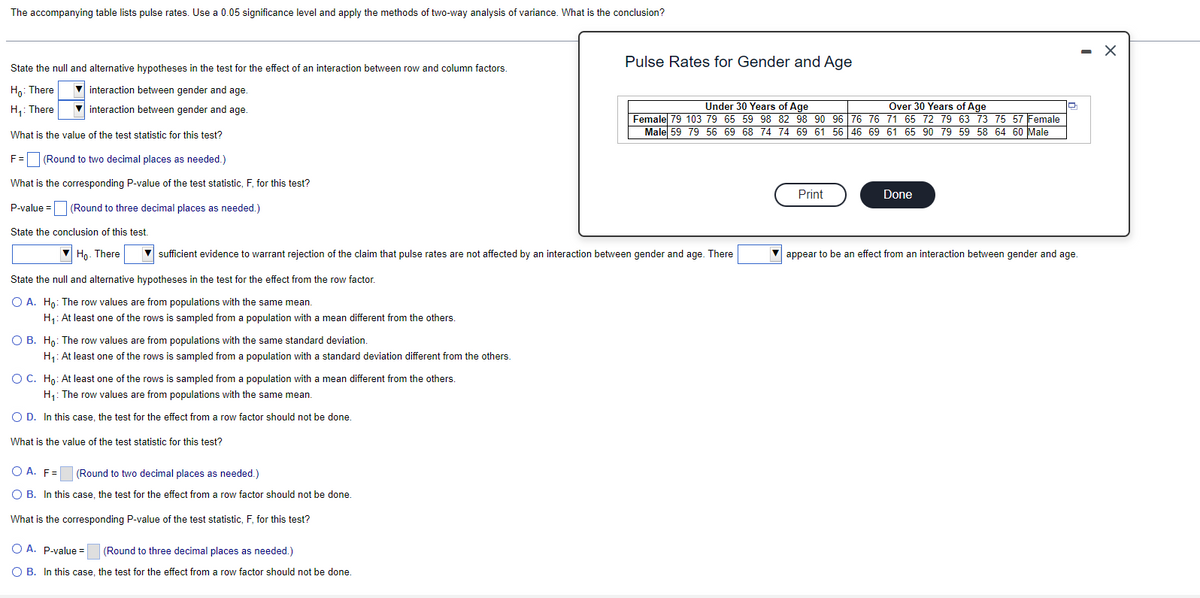
Transcribed Image Text:The accompanying table lists pulse rates. Use a 0.05 significance level and apply the methods of two-way analysis of variance. What is the conclusion?
State the null and alternative hypotheses in the test for the effect of an interaction between row and column factors.
Ho: There
interaction between gender and age.
H₁: There
interaction between gender and age.
What is the value of the test statistic for this test?
O B. Ho: The row values are from populations with the same standard deviation.
H₁: At least one of the rows is sampled from a population with a standard deviation different from the others.
F= (Round to two decimal places as needed.)
What is the corresponding P-value of the test statistic, F, for this test?
P-value =
(Round to three decimal places as needed.)
State the conclusion of this test.
Ho. There
sufficient evidence to warrant rejection of the claim that pulse rates are not affected by an interaction between gender and age. There
State the null and alternative hypotheses in the test for the effect from the row factor.
O A. Ho: The row values are from populations with the same mean.
H₁: At least one of the rows is sampled from a population with a mean different from the others.
O C. Ho: At least one of the rows is sampled from a population with a mean different from the others.
H₁: The row values are from populations with the same mean.
O D. In this case, the test for the effect from a row factor should not be done.
What is the value of the test statistic for this test?
OA. F=
(Round to two decimal places as needed.)
O B. In this case, the test for the effect from a row factor should not be done.
What is the corresponding P-value of the test statistic, F, for this test?
Pulse Rates for Gender and Age
O A. P-value =
(Round to three decimal places as needed.)
O B. In this case, the test for the effect from a row factor should not be done.
Under 30 Years of Age
Over 30 Years of Age
Female 79 103 79 65 59 98 82 98 90 96 76 76 71 65 72 79 63 73 75 57 Female
Male 59 79 56 69 68 74 74 69 61 56 46 69 61 65 90 79 59 58 64 60 Male
Print
Done
appear to be an effect from an interaction between gender and age.
-
X
Expert Solution
This question has been solved!
Explore an expertly crafted, step-by-step solution for a thorough understanding of key concepts.

This is a popular solution!

Trending now
This is a popular solution!

Step by step
Solved in 4 steps with 1 images

Recommended textbooks for you
MATLAB: An Introduction with Applications
Statistics
ISBN:
9781119256830
Author:
Amos Gilat
Publisher:
John Wiley & Sons Inc

Probability and Statistics for Engineering and th…
Statistics
ISBN:
9781305251809
Author:
Jay L. Devore
Publisher:
Cengage Learning

Statistics for The Behavioral Sciences (MindTap C…
Statistics
ISBN:
9781305504912
Author:
Frederick J Gravetter, Larry B. Wallnau
Publisher:
Cengage Learning
MATLAB: An Introduction with Applications
Statistics
ISBN:
9781119256830
Author:
Amos Gilat
Publisher:
John Wiley & Sons Inc
Probability and Statistics for Engineering and th…
Statistics
ISBN:
9781305251809
Author:
Jay L. Devore
Publisher:
Cengage Learning
Statistics for The Behavioral Sciences (MindTap C…
Statistics
ISBN:
9781305504912
Author:
Frederick J Gravetter, Larry B. Wallnau
Publisher:
Cengage Learning

Elementary Statistics: Picturing the World (7th E…
Statistics
ISBN:
9780134683416
Author:
Ron Larson, Betsy Farber
Publisher:
PEARSON

The Basic Practice of Statistics
Statistics
ISBN:
9781319042578
Author:
David S. Moore, William I. Notz, Michael A. Fligner
Publisher:
W. H. Freeman

Introduction to the Practice of Statistics
Statistics
ISBN:
9781319013387
Author:
David S. Moore, George P. McCabe, Bruce A. Craig
Publisher:
W. H. Freeman