The accompanying table lists the ages of acting award winners matched by the years in which the awards were won. Construct a scatterplot, find the value of the linear correlation coefficient r, and find the P-value of r. Determine whether there is sufficient evidence to support a claim of linear correlation between the two variables. Should we expect that there would be a correlation? Use a significance level of a = 0.01. E Click the icon to view the ages of the award winners. ..... Construct a scatterplot. Choose the correct graph below. O A. O B. Oc. OD. 70- 70 70- 70- 20- 20 Best Actress (years) 20 Best Actress (years) 20 Best Actress (years) 70 70 Best Actress (years) Best Actresses and Best Actors Best Actress 27 29 29 65 33 33 44 30 64 22 46 54 O Best Actor 44 35 39 47 53 50 57 52 39 53 42 32 Best Actor (years) Best Actor (
The accompanying table lists the ages of acting award winners matched by the years in which the awards were won. Construct a scatterplot, find the value of the linear correlation coefficient r, and find the P-value of r. Determine whether there is sufficient evidence to support a claim of linear correlation between the two variables. Should we expect that there would be a correlation? Use a significance level of a = 0.01. E Click the icon to view the ages of the award winners. ..... Construct a scatterplot. Choose the correct graph below. O A. O B. Oc. OD. 70- 70 70- 70- 20- 20 Best Actress (years) 20 Best Actress (years) 20 Best Actress (years) 70 70 Best Actress (years) Best Actresses and Best Actors Best Actress 27 29 29 65 33 33 44 30 64 22 46 54 O Best Actor 44 35 39 47 53 50 57 52 39 53 42 32 Best Actor (years) Best Actor (

Big Ideas Math A Bridge To Success Algebra 1: Student Edition 2015
1st Edition
ISBN:9781680331141
Author:HOUGHTON MIFFLIN HARCOURT
Publisher:HOUGHTON MIFFLIN HARCOURT
Chapter4: Writing Linear Equations
Section: Chapter Questions
Problem 11CT

Related questions
Question
100%
2- I need help with this stats exercise, it has 7 parts so please provide the answer for all of them since I struggle with all the parts of the exercise.
The last part which is a sentence has the options of
-Because the P-value of the linear
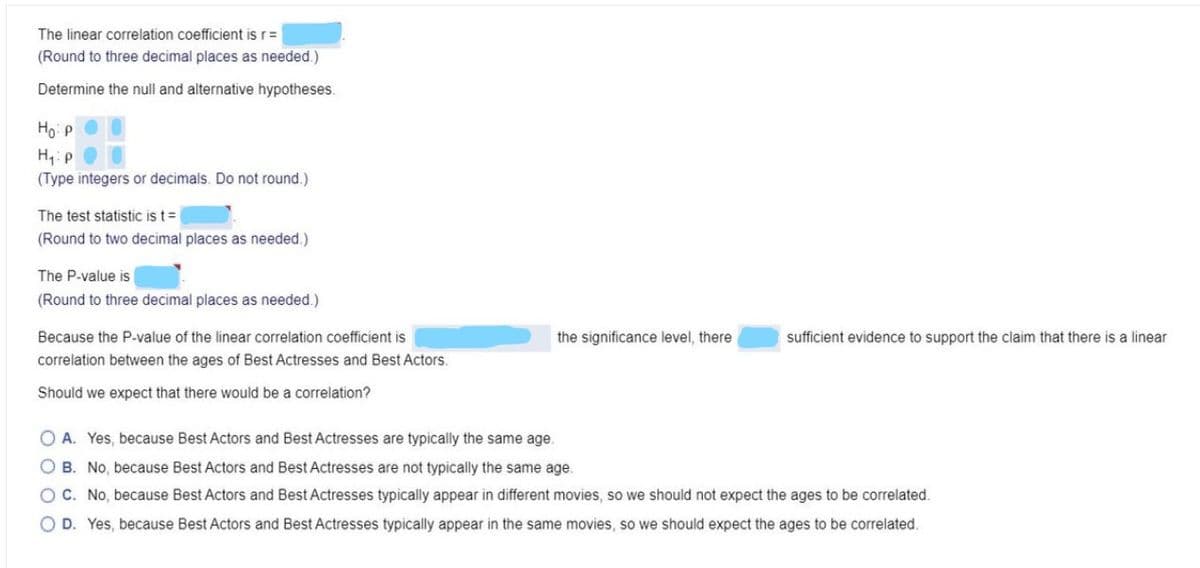
Transcribed Image Text:The linear correlation coefficient is r=
(Round to three decimal places as needed.)
Determine the null and alternative hypotheses.
Ho P
H,: P
(Type integers or decimals. Do not round.)
The test statistic is t=
(Round to two decimal places as needed.)
The P-value is
(Round to three decimal places as needed.)
Because the P-value of the linear correlation coefficient is
the significance level, there
sufficient evidence to support the claim that there is a linear
correlation between the ages of Best Actresses and Best Actors.
Should we expect that there would be a correlation?
O A. Yes, because Best Actors and Best Actresses are typically the same age.
O B. No, because Best Actors and Best Actresses are not typically the same age.
OC. No, because Best Actors and Best Actresses typically appear in different movies, so we should not expect the ages to be correlated.
O D. Yes, because Best Actors and Best Actresses typically appear in the same movies, so we should expect the ages to be correlated.
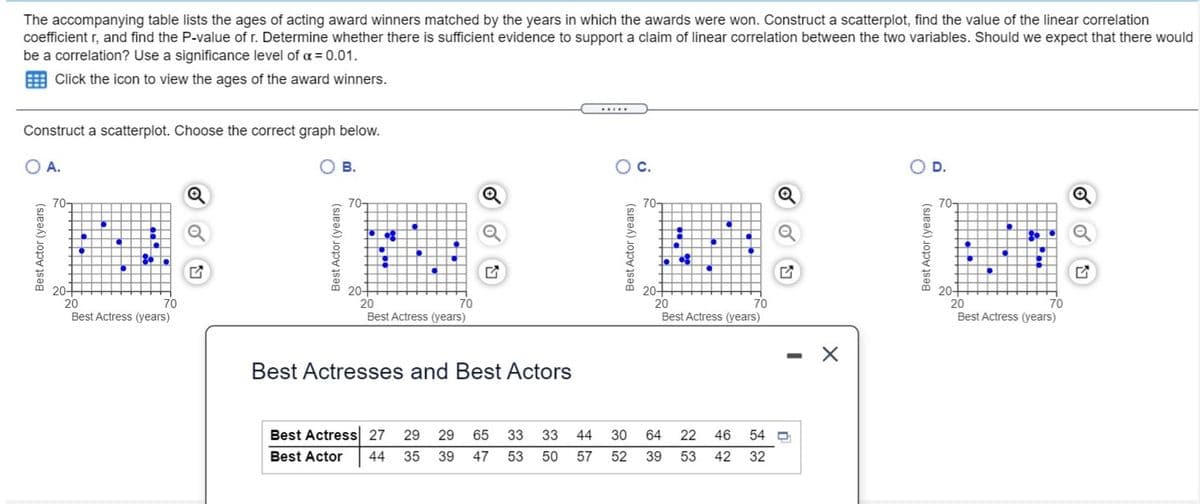
Transcribed Image Text:The accompanying table lists the ages of acting award winners matched by the years in which the awards were won. Construct a scatterplot, find the value of the linear correlation
coefficient r, and find the P-value of r. Determine whether there is sufficient evidence to support a claim of linear correlation between the two variables. Should we expect that there would
be a correlation? Use a significance level of a = 0.01.
E Click the icon to view the ages of the award winners.
.....
Construct a scatterplot. Choose the correct graph below.
O A.
O B.
C.
OD.
70-
70-
70-
20+
20
Best Actress (years)
20-
20
Best Actress (years)
20+
20
Best Actress (years)
70
70
20
Best Actress (years)
70
70
%3
Best Actresses and Best Actors
Best Actress 27
29
29
65
33
33
44
30
64
22
46
54 O
Best Actor
44
35
39
47
53
50
57
52
39
53
42
32
Best Actor (years)
Best Actor (years)
Best Actor (years)
Best Actor (years)
HH P.
Expert Solution
This question has been solved!
Explore an expertly crafted, step-by-step solution for a thorough understanding of key concepts.

This is a popular solution!

Trending now
This is a popular solution!

Step by step
Solved in 2 steps with 1 images

Recommended textbooks for you
Big Ideas Math A Bridge To Success Algebra 1: Stu…
Algebra
ISBN:
9781680331141
Author:
HOUGHTON MIFFLIN HARCOURT
Publisher:
Houghton Mifflin Harcourt

Glencoe Algebra 1, Student Edition, 9780079039897…
Algebra
ISBN:
9780079039897
Author:
Carter
Publisher:
McGraw Hill
Big Ideas Math A Bridge To Success Algebra 1: Stu…
Algebra
ISBN:
9781680331141
Author:
HOUGHTON MIFFLIN HARCOURT
Publisher:
Houghton Mifflin Harcourt
Glencoe Algebra 1, Student Edition, 9780079039897…
Algebra
ISBN:
9780079039897
Author:
Carter
Publisher:
McGraw Hill