The accompanying table shows the ages (in years) of 11 children and the numbers of words in their vocabulary. Complete parts (a) through (d) below. Click here to view the data table. Click here to view the table of critical values for the Pearson correlation coefficient, (a) Dispiay tne ata in a scatter piot. Cnoose tne correct grapn Deiow. O A. OB. Oc. OD. Q 3000 2400 1800 1200 600 3000 2400 * 1800- 4 1200- 600- 2- 2- 24 6 Age (years) 2 4 68 Age (years) 3000 1500 Age (years) 1500 3000 Age (years) (b) Calculate the sample correlation coefficient r. (Round to three decimal places as needed.) (c) Describe the type of correlation, if any, and interpret the correlation in the context of the data. There is V linear correlation. Interpret the correlation. Choose the correct answer below. O A. Based on the correlation, there does not appear to be a linear relationship between children's ages and the number of words in their vocabulary O B. As age increases, the number of words in children's vocabulary tends to increase. OC. Aging causes the number of words in children's vocabulary to increase. O D. Aging causes the number of words in children's vocabulary to decrease. O E. Based on the correlation, there does not appear to be any relationship between children's ages and the number of words in their vocabulary. OF. As age increases, the number of words in children's vocabulary tends to decrease.
The accompanying table shows the ages (in years) of 11 children and the numbers of words in their vocabulary. Complete parts (a) through (d) below. Click here to view the data table. Click here to view the table of critical values for the Pearson correlation coefficient, (a) Dispiay tne ata in a scatter piot. Cnoose tne correct grapn Deiow. O A. OB. Oc. OD. Q 3000 2400 1800 1200 600 3000 2400 * 1800- 4 1200- 600- 2- 2- 24 6 Age (years) 2 4 68 Age (years) 3000 1500 Age (years) 1500 3000 Age (years) (b) Calculate the sample correlation coefficient r. (Round to three decimal places as needed.) (c) Describe the type of correlation, if any, and interpret the correlation in the context of the data. There is V linear correlation. Interpret the correlation. Choose the correct answer below. O A. Based on the correlation, there does not appear to be a linear relationship between children's ages and the number of words in their vocabulary O B. As age increases, the number of words in children's vocabulary tends to increase. OC. Aging causes the number of words in children's vocabulary to increase. O D. Aging causes the number of words in children's vocabulary to decrease. O E. Based on the correlation, there does not appear to be any relationship between children's ages and the number of words in their vocabulary. OF. As age increases, the number of words in children's vocabulary tends to decrease.

Glencoe Algebra 1, Student Edition, 9780079039897, 0079039898, 2018
18th Edition
ISBN:9780079039897
Author:Carter
Publisher:Carter
Chapter4: Equations Of Linear Functions
Section4.5: Correlation And Causation
Problem 15PPS

Related questions
Question
Transcribed Image Text:The accompanying table shows the ages (in years) of 11 children and the numbers of words in their vocabulary. Complete parts (a) through (d) below.
Click here to view the data table. Click here to view the table of critical values for the Pearson correlation coefficient.
...
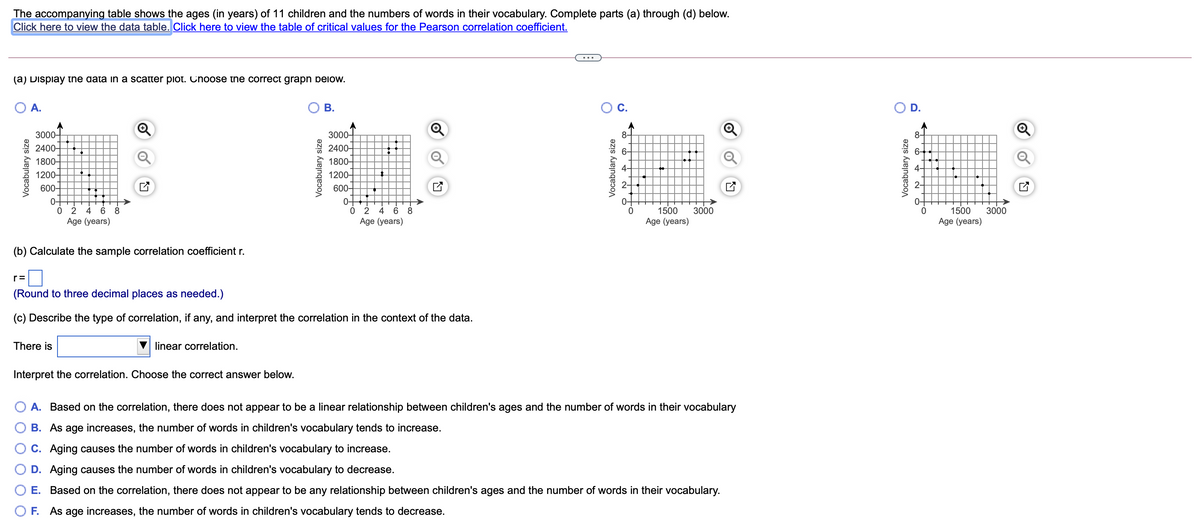
(a) Dispiay tne aata in a scatter piot. Choose the correct grapn pelow.
OA.
В.
C.
O D.
3000-
3000-
2400-
2400-
1800–
1800-
1200-
1200-
600-
600-
0 2 4 6 8
Age (years)
0-
0 2 4 6
Age (years)
1500
Age (years)
8
1500
3000
3000
Age (years)
(b) Calculate the sample correlation coefficient r.
r=
(Round to three decimal places as needed.)
(c) Describe the type of correlation, if any, and interpret the correlation in the context of the data.
There is
linear correlation.
Interpret the correlation. Choose the correct answer below.
A. Based on the correlation, there does not appear to be a linear relationship between children's ages and the number of words in their vocabulary
B. As age increases, the number of words in children's vocabulary tends to increase.
C. Aging causes the number of words in children's vocabulary to increase.
D. Aging causes the number of words in children's vocabulary to decrease.
E. Based on the correlation, there does not appear to be any relationship between children's ages and the number of words in their vocabulary.
O F. As age increases, the number of words in children's vocabulary tends to decrease.
Vocabulary size
Vocabulary size
+ +++ Ho
Transcribed Image Text:The accompanying table shows the ages (in years) of 11 children and the numbers of words in their vocabulary. Complete parts (a) through (d) below.
Click here to view the data table. Click here to view the table of critical values for the Pearson correlation coefficient.
(a) Display the data in a scatter plot. Choose the correct graph below.
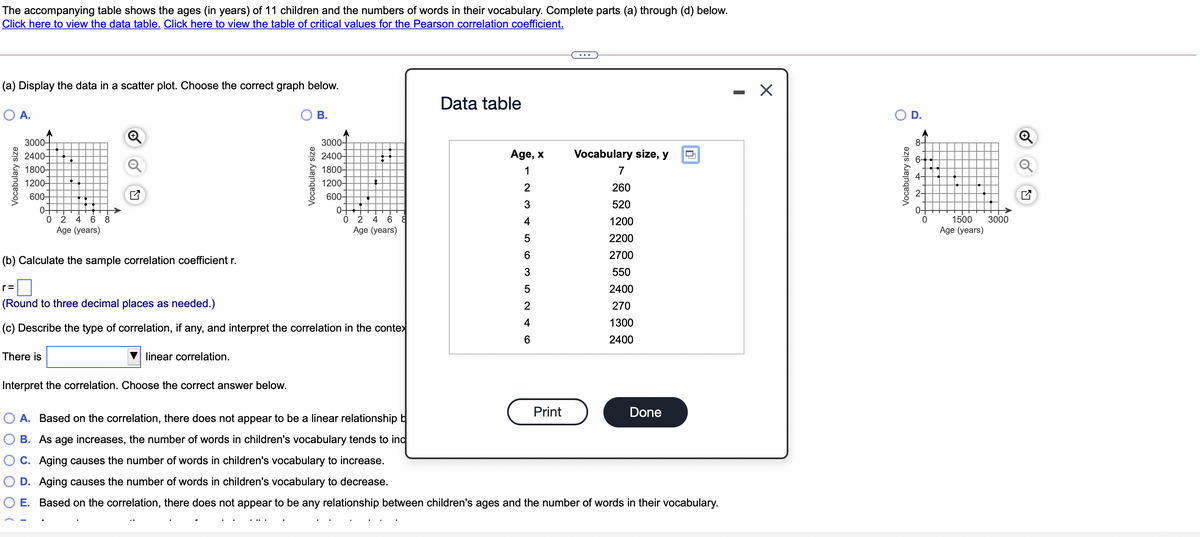
Data table
O A.
В.
D.
3000-
2400-
1800-
1200-
3000-
2400-
Age, x
Vocabulary size, y
1800-
1
7
1200-
260
2-
600-
600-
3
520
0-
0 2 4
Age (years)
0-
6 8
Age (years)
1500
Age (years)
6
4
1200
3000
5
2200
6
2700
(b) Calculate the sample correlation coefficient r.
550
r=
2400
(Round to three decimal places as needed.)
2
270
4
1300
(c) Describe the type of correlation, if any, and interpret the correlation in the contex
2400
There is
linear correlation.
Interpret the correlation. Choose the correct answer below.
Print
Done
O A. Based on the correlation, there does not appear to be a linear relationship b
B. As age increases, the number of words in children's vocabulary tends to ind
C. Aging causes the number of words in children's vocabulary to increase.
D. Aging causes the number of words in children's vocabulary to decrease.
E. Based on the correlation, there does not appear to be any relationship between children's ages and the number of words in their vocabulary.
Vocabulary size
Vocabulary size
Vocabulary size
Expert Solution
This question has been solved!
Explore an expertly crafted, step-by-step solution for a thorough understanding of key concepts.

This is a popular solution!

Trending now
This is a popular solution!

Step by step
Solved in 3 steps with 6 images

Recommended textbooks for you
Glencoe Algebra 1, Student Edition, 9780079039897…
Algebra
ISBN:
9780079039897
Author:
Carter
Publisher:
McGraw Hill

Big Ideas Math A Bridge To Success Algebra 1: Stu…
Algebra
ISBN:
9781680331141
Author:
HOUGHTON MIFFLIN HARCOURT
Publisher:
Houghton Mifflin Harcourt
Glencoe Algebra 1, Student Edition, 9780079039897…
Algebra
ISBN:
9780079039897
Author:
Carter
Publisher:
McGraw Hill
Big Ideas Math A Bridge To Success Algebra 1: Stu…
Algebra
ISBN:
9781680331141
Author:
HOUGHTON MIFFLIN HARCOURT
Publisher:
Houghton Mifflin Harcourt