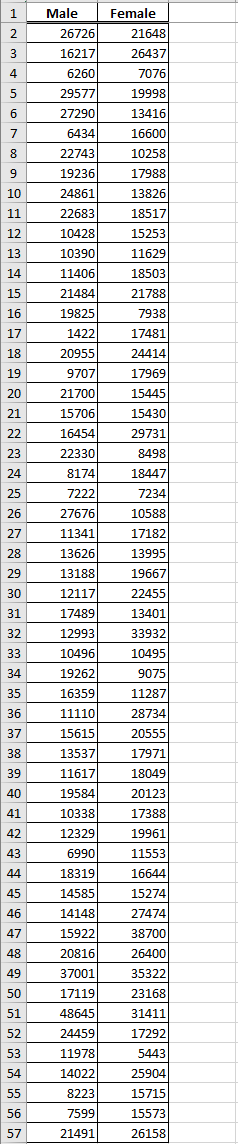
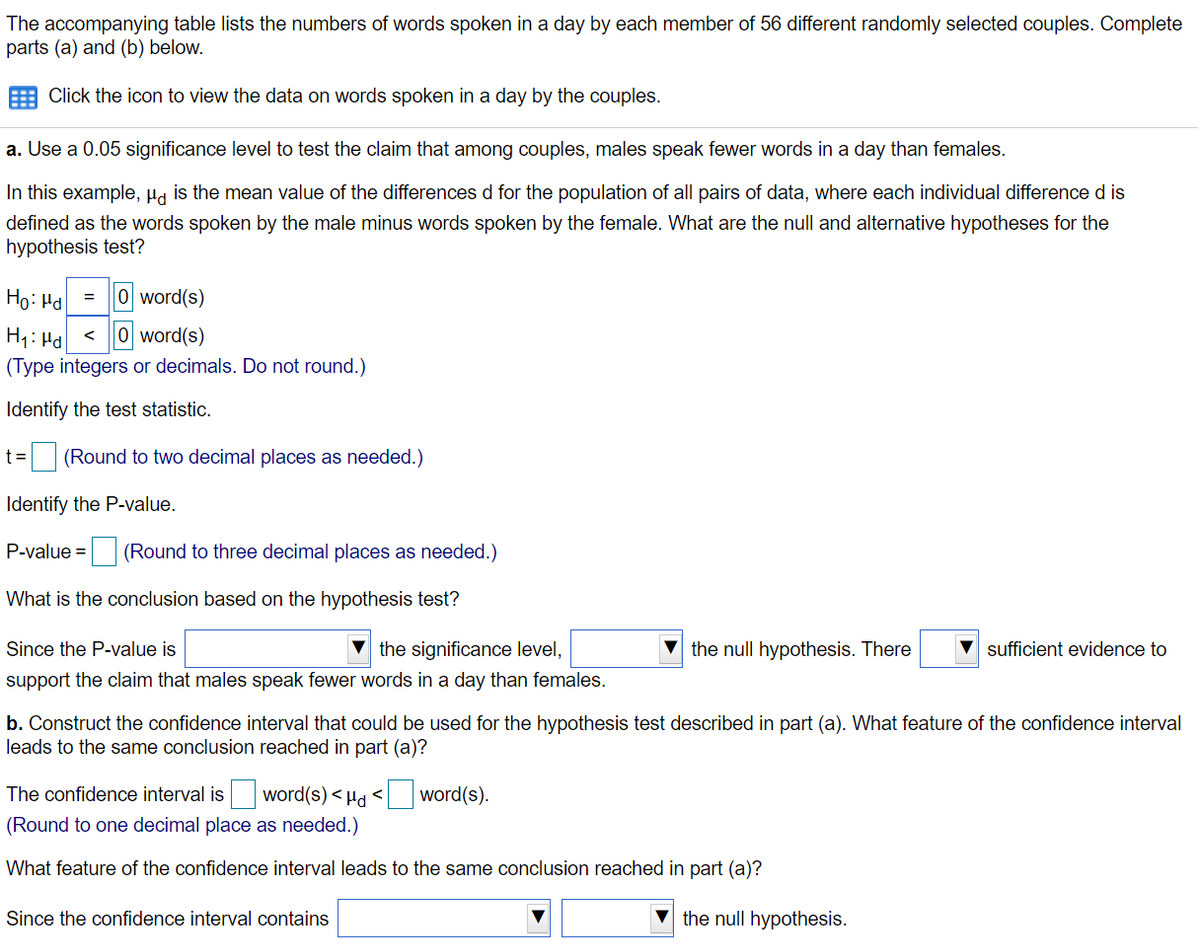
The accompanying table lists the numbers of words spoken in a day by each member of 56 different randomly selected couples. Complete parts (a) and (b) below. E Click the icon to view the data on words spoken in a day by the couples. a. Use a 0.05 significance level to test the claim that among couples, males speak fewer words in a day than females. In this example, Ha is the mean value of the differences d for the population of all pairs of data, where each individual difference d is defined as the words spoken by the male minus words spoken by the female. What are the null and alternative hypotheses for the hypothesis test? Ho: Ha = 0 word(s) < 0 word(s) H1: Hd (Type integers or decimals. Do not round.) Identify the test statistic. t = (Round to two decimal places as needed.) Identify the P-value. P-value = (Round to three decimal places as needed.) What is the conclusion based on the hypothesis test? Since the P-value is the significance level, the null hypothesis. There sufficient evidence to support the claim that males speak fewer words in a day than females.


Inverse Normal Distribution
The method used for finding the corresponding z-critical value in a normal distribution using the known probability is said to be an inverse normal distribution. The inverse normal distribution is a continuous probability distribution with a family of two parameters.
Mean, Median, Mode
It is a descriptive summary of a data set. It can be defined by using some of the measures. The central tendencies do not provide information regarding individual data from the dataset. However, they give a summary of the data set. The central tendency or measure of central tendency is a central or typical value for a probability distribution.
Z-Scores
A z-score is a unit of measurement used in statistics to describe the position of a raw score in terms of its distance from the mean, measured with reference to standard deviation from the mean. Z-scores are useful in statistics because they allow comparison between two scores that belong to different normal distributions.


Trending now
This is a popular solution!

Step by step
Solved in 3 steps


