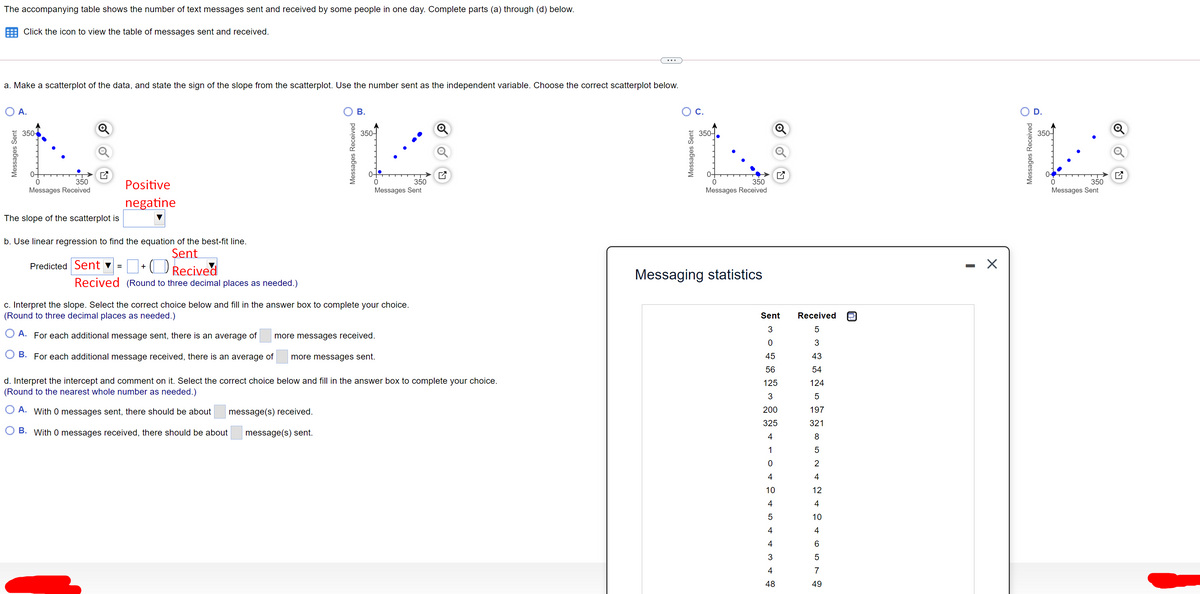
The accompanying table shows the number of text messages sent and received by some people in one day. Complete parts (a) through (d) below. E Click the icon to view the table of messages sent and received. a. Make a scatterplot of the data, and state the sign of the slope from the scatterplot. Use the number sent as the independent variable. Choose the correct scatterplot below. OA. OB. Oc. OD. 350 350- Positive 350 Messages Sent 350 Messages Sent Messages Received Messages Received negatine The slope of the scatterplot is b. Use linear regression to find the equation of the best-fit line. Sent Predicted Sent -D•OReciveč - X Messaging statistics Recived (Round to three decimal places as needed.) c. Interpret the slope. Select the correct choice below and fill in the answer box to complete your choice (Round to three decimal places as needed.) Sent Received O 3 O A. For each additional message sent, there is an average of more messages received. 3 O B. For each additional message received, there is an average of more messages sent. 45 43 56 54 d. Interpret the intercept and comment on it. Select the correct choice below and fill in the answer box to complete your choice. (Round to the nearest whole number as needed.) 125 124 3 5 O A. With O messages sent, there should be about message(s) received. 200 197 325 321 O B. With O messages received, there should be about message(s) sent. . 8 4 1 2 4 4 10 12 4 4 5 10 4 4 4 3. 5 4 7
The accompanying table shows the number of text messages sent and received by some people in one day. Complete parts (a) through (d) below. E Click the icon to view the table of messages sent and received. a. Make a scatterplot of the data, and state the sign of the slope from the scatterplot. Use the number sent as the independent variable. Choose the correct scatterplot below. OA. OB. Oc. OD. 350 350- Positive 350 Messages Sent 350 Messages Sent Messages Received Messages Received negatine The slope of the scatterplot is b. Use linear regression to find the equation of the best-fit line. Sent Predicted Sent -D•OReciveč - X Messaging statistics Recived (Round to three decimal places as needed.) c. Interpret the slope. Select the correct choice below and fill in the answer box to complete your choice (Round to three decimal places as needed.) Sent Received O 3 O A. For each additional message sent, there is an average of more messages received. 3 O B. For each additional message received, there is an average of more messages sent. 45 43 56 54 d. Interpret the intercept and comment on it. Select the correct choice below and fill in the answer box to complete your choice. (Round to the nearest whole number as needed.) 125 124 3 5 O A. With O messages sent, there should be about message(s) received. 200 197 325 321 O B. With O messages received, there should be about message(s) sent. . 8 4 1 2 4 4 10 12 4 4 5 10 4 4 4 3. 5 4 7

Holt Mcdougal Larson Pre-algebra: Student Edition 2012
1st Edition
ISBN:9780547587776
Author:HOLT MCDOUGAL
Publisher:HOLT MCDOUGAL
Chapter12: Angle Relationships And Transformations
Section: Chapter Questions
Problem 5PTTS

Related questions
Question
The accompanying table shows the number of text messages sent and received by some people in one day. Complete parts (a) through (d) below.
Transcribed Image Text:The accompanying table shows the number of text messages sent and received by some people in one day. Complete parts (a) through (d) below.
Click the icon to view the table of messages sent and received.
a. Make a scatterplot of the data, and state the sign of the slope from the scatterplot. Use the number sent as the independent variable. Choose the correct scatterplot below.
A.
C.
D.
350-
350-
350-
350-
0-
0-
0-
350
Messages Sent
350
Positive
350
350
Messages Received
Messages Received
Messages Sent
negatine
The slope of the scatterplot is
b. Use linear regression to find the equation of the best-fit line.
Şent
O Recived
- X
Predicted Sent ♥ =
+
Messaging statistics
Recived (Round to three decimal places as needed.)
c. Interpret the slope. Select the correct choice below and fill in the answer box to complete your choice.
(Round to three decimal places as needed.)
Sent
Received
3
A. For each additional message sent, there is an average of
more messages received.
B. For each additional message received, there is an average of
more messages sent.
45
43
56
54
d. Interpret the intercept and comment on it. Select the correct choice below and fill in the answer box to complete your choice.
(Round to the nearest whole number as needed.)
125
124
3
A. With 0 messages sent, there should be about
message(s) received.
200
197
325
321
B. With 0 messages received, there should be about
message(s) sent.
4
8
1
4
10
12
4
4
10
4
4
48
49
Messages Sent
Messages Received
B.
Messages Sent
- 4 3 4 유
5 3 5 9 5 2 4 6 5 7
Messages Received
Expert Solution
This question has been solved!
Explore an expertly crafted, step-by-step solution for a thorough understanding of key concepts.

This is a popular solution!

Trending now
This is a popular solution!

Step by step
Solved in 2 steps with 2 images

Recommended textbooks for you
Holt Mcdougal Larson Pre-algebra: Student Edition…
Algebra
ISBN:
9780547587776
Author:
HOLT MCDOUGAL
Publisher:
HOLT MCDOUGAL

Glencoe Algebra 1, Student Edition, 9780079039897…
Algebra
ISBN:
9780079039897
Author:
Carter
Publisher:
McGraw Hill

Holt Mcdougal Larson Pre-algebra: Student Edition…
Algebra
ISBN:
9780547587776
Author:
HOLT MCDOUGAL
Publisher:
HOLT MCDOUGAL
Glencoe Algebra 1, Student Edition, 9780079039897…
Algebra
ISBN:
9780079039897
Author:
Carter
Publisher:
McGraw Hill

Big Ideas Math A Bridge To Success Algebra 1: Stu…
Algebra
ISBN:
9781680331141
Author:
HOUGHTON MIFFLIN HARCOURT
Publisher:
Houghton Mifflin Harcourt