Taylor's baseball team played a full 9-inning game. The team scored 4 runs in every inning, and for every 2 runs it scored, it had 5 hits. What is an appropriate process for finding how many total hits the team had? Make a tree diagram with 1 inning as the starting point. Draw 4 branches to represent the runs. Connect every 2 runs to a single node and draw 5 branches to represent the hits. Multiply the number of hits by 9 to find the number of hits in the full 9-inning game. Make a table with one column for runs and one for hits. Start with 4 runs and 2 hits, then increase each column by 5 for 9 rows to find the number of hits in the full 9-inning game. Make a graph with the number of hits on the x-axis and the number of runs on the y-axis. Start at 0 hits and 0 runs, then add 5 hits for every 4 runs. Continue this pattern 9 times to find the number of hits in the full 9-inning game. Make two tape diagrams, one with 4 rectangles to represent the number of runs, and one with 5 rectangles to represent the number of hits. Continue each tape 9 times to represent the 9 innings. Count the number of rectangles that represent hits.
Taylor's baseball team played a full 9-inning game. The team scored 4 runs in every inning, and for every 2 runs it scored, it had 5 hits. What is an appropriate process for finding how many total hits the team had? Make a tree diagram with 1 inning as the starting point. Draw 4 branches to represent the runs. Connect every 2 runs to a single node and draw 5 branches to represent the hits. Multiply the number of hits by 9 to find the number of hits in the full 9-inning game. Make a table with one column for runs and one for hits. Start with 4 runs and 2 hits, then increase each column by 5 for 9 rows to find the number of hits in the full 9-inning game. Make a graph with the number of hits on the x-axis and the number of runs on the y-axis. Start at 0 hits and 0 runs, then add 5 hits for every 4 runs. Continue this pattern 9 times to find the number of hits in the full 9-inning game. Make two tape diagrams, one with 4 rectangles to represent the number of runs, and one with 5 rectangles to represent the number of hits. Continue each tape 9 times to represent the 9 innings. Count the number of rectangles that represent hits.

Chapter9: Sequences, Probability And Counting Theory
Section: Chapter Questions
Problem 18PT: To allocate annual bonuses, a manager must choose his top four employees and rank them first to...

Related questions
Question
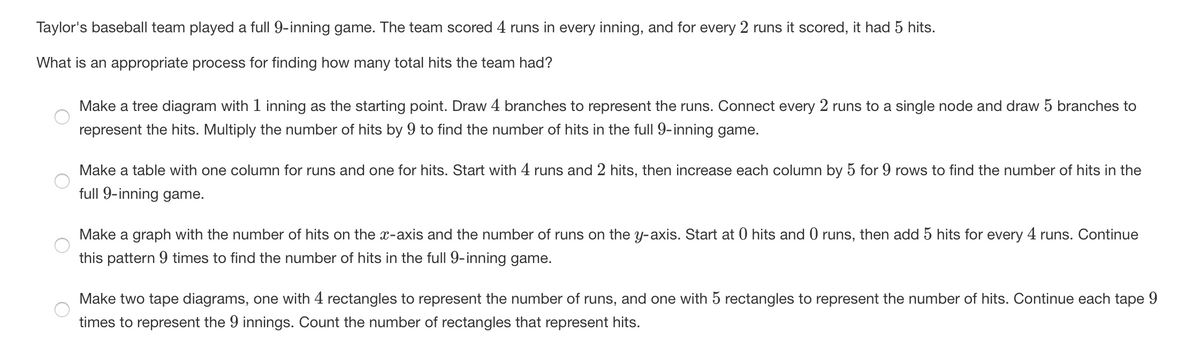
Transcribed Image Text:Taylor's baseball team played a full 9-inning game. The team scored 4 runs in every inning, and for every 2 runs it scored, it had 5 hits.
What is an appropriate process for finding how many total hits the team had?
Make a tree diagram with 1 inning as the starting point. Draw 4 branches to represent the runs. Connect every 2 runs to a single node and draw 5 branches to
represent the hits. Multiply the number of hits by 9 to find the number of hits in the full 9-inning game.
Make a table with one column for runs and one for hits. Start with 4 runs and 2 hits, then increase each column by 5 for 9 rows to find the number of hits in the
full 9-inning game.
Make a graph with the number of hits on the x-axis and the number of runs on the y-axis. Start at 0 hits and 0 runs, then add 5 hits for every 4 runs. Continue
this pattern 9 times to find the number of hits in the full 9-inning game.
Make two tape diagrams, one with 4 rectangles to represent the number of runs, and one with 5 rectangles to represent the number of hits. Continue each tape 9
times to represent the 9 innings. Count the number of rectangles that represent hits.
Expert Solution
This question has been solved!
Explore an expertly crafted, step-by-step solution for a thorough understanding of key concepts.

This is a popular solution!

Trending now
This is a popular solution!

Step by step
Solved in 2 steps with 2 images

Recommended textbooks for you

Algebra & Trigonometry with Analytic Geometry
Algebra
ISBN:
9781133382119
Author:
Swokowski
Publisher:
Cengage

Algebra: Structure And Method, Book 1
Algebra
ISBN:
9780395977224
Author:
Richard G. Brown, Mary P. Dolciani, Robert H. Sorgenfrey, William L. Cole
Publisher:
McDougal Littell
Algebra & Trigonometry with Analytic Geometry
Algebra
ISBN:
9781133382119
Author:
Swokowski
Publisher:
Cengage
Algebra: Structure And Method, Book 1
Algebra
ISBN:
9780395977224
Author:
Richard G. Brown, Mary P. Dolciani, Robert H. Sorgenfrey, William L. Cole
Publisher:
McDougal Littell

Holt Mcdougal Larson Pre-algebra: Student Edition…
Algebra
ISBN:
9780547587776
Author:
HOLT MCDOUGAL
Publisher:
HOLT MCDOUGAL