The ages (in years) and heights (in inches) of all pitchers for a baseball team are listed. Find the coefficient of variation for each of the two data sets. Then compare the results. Click the icon to view the data sets. CV heights = 4.1 % (Round to one decimal place as needed.) CV ages 15.5% (Round to one decimal place as needed.) Compare the results. What can you conclude? O A. Heights are more variable than ages for all pitchers on this team. B. Ages are more variable than heights for all pitchers on this team. OC. Ages and heights for all pitchers on this team have about the same amount of variability.
The ages (in years) and heights (in inches) of all pitchers for a baseball team are listed. Find the coefficient of variation for each of the two data sets. Then compare the results. Click the icon to view the data sets. CV heights = 4.1 % (Round to one decimal place as needed.) CV ages 15.5% (Round to one decimal place as needed.) Compare the results. What can you conclude? O A. Heights are more variable than ages for all pitchers on this team. B. Ages are more variable than heights for all pitchers on this team. OC. Ages and heights for all pitchers on this team have about the same amount of variability.

Glencoe Algebra 1, Student Edition, 9780079039897, 0079039898, 2018
18th Edition
ISBN:9780079039897
Author:Carter
Publisher:Carter
Chapter4: Equations Of Linear Functions
Section4.6: Regression And Median-fit Lines
Problem 1AGP

Related questions
Question
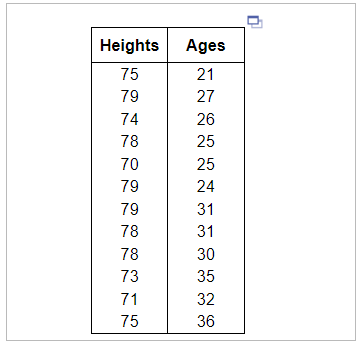
Transcribed Image Text:Heights Ages
75
21
79
27
74
26
78
25
70
25
79
24
79
31
78
31
78
73
71
75
30
35
32
36
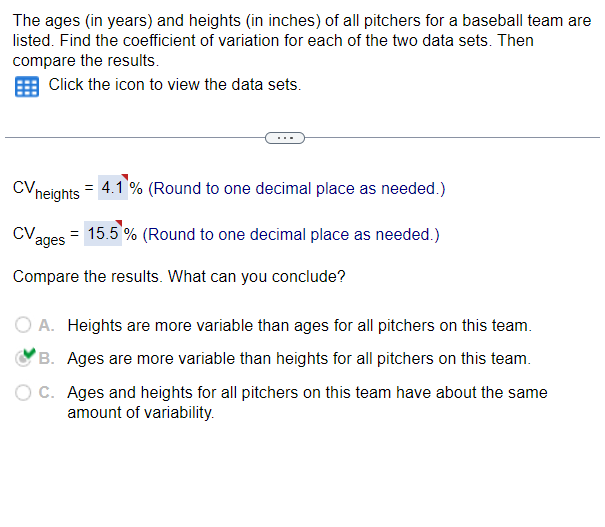
Transcribed Image Text:The ages (in years) and heights (in inches) of all pitchers for a baseball team are
listed. Find the coefficient of variation for each of the two data sets. Then
compare the results.
Click the icon to view the data sets.
CV heights
= 4.1% (Round to one decimal place as needed.)
CV₂ = 15.5% (Round to one decimal place as needed.)
ages
Compare the results. What can you conclude?
A. Heights are more variable than ages for all pitchers on this team.
B. Ages are more variable than heights for all pitchers on this team.
O C.
Ages and heights for all pitchers on this team have about the same
amount of variability.
Expert Solution
This question has been solved!
Explore an expertly crafted, step-by-step solution for a thorough understanding of key concepts.

This is a popular solution!

Trending now
This is a popular solution!

Step by step
Solved in 5 steps with 9 images

Recommended textbooks for you
Glencoe Algebra 1, Student Edition, 9780079039897…
Algebra
ISBN:
9780079039897
Author:
Carter
Publisher:
McGraw Hill

Big Ideas Math A Bridge To Success Algebra 1: Stu…
Algebra
ISBN:
9781680331141
Author:
HOUGHTON MIFFLIN HARCOURT
Publisher:
Houghton Mifflin Harcourt

Algebra: Structure And Method, Book 1
Algebra
ISBN:
9780395977224
Author:
Richard G. Brown, Mary P. Dolciani, Robert H. Sorgenfrey, William L. Cole
Publisher:
McDougal Littell
Glencoe Algebra 1, Student Edition, 9780079039897…
Algebra
ISBN:
9780079039897
Author:
Carter
Publisher:
McGraw Hill
Big Ideas Math A Bridge To Success Algebra 1: Stu…
Algebra
ISBN:
9781680331141
Author:
HOUGHTON MIFFLIN HARCOURT
Publisher:
Houghton Mifflin Harcourt
Algebra: Structure And Method, Book 1
Algebra
ISBN:
9780395977224
Author:
Richard G. Brown, Mary P. Dolciani, Robert H. Sorgenfrey, William L. Cole
Publisher:
McDougal Littell

Holt Mcdougal Larson Pre-algebra: Student Edition…
Algebra
ISBN:
9780547587776
Author:
HOLT MCDOUGAL
Publisher:
HOLT MCDOUGAL

Functions and Change: A Modeling Approach to Coll…
Algebra
ISBN:
9781337111348
Author:
Bruce Crauder, Benny Evans, Alan Noell
Publisher:
Cengage Learning