Body frame size is determined by a person's wrist circumference in relation to height. A researcher measures the wrist circumference and height of a random sample of individuals. The data is displayed below. Height (in) 85 80 75 70 65 60 ● 5 5.5 6 6.5 7 7.5 8 8.5 9 Wrist Circumference (in) Q Excel Output: Regression Statistics Multiple R R Square Adjusted R Square Standard Error Observations (Intercept) wrist 0.6492 0.4214 Et 0.4021 4.9094 32 Coefficients Standard Error 36.891 7.64 4.9732 Round answers to 4 decimal places. a) Write the equation of best-fit line. y = 36.891 +4.9732 x t-Stat P-value 4.8287 4.0E-5 1.0639 4.6743 6.0E-5 0° DOLL
Body frame size is determined by a person's wrist circumference in relation to height. A researcher measures the wrist circumference and height of a random sample of individuals. The data is displayed below. Height (in) 85 80 75 70 65 60 ● 5 5.5 6 6.5 7 7.5 8 8.5 9 Wrist Circumference (in) Q Excel Output: Regression Statistics Multiple R R Square Adjusted R Square Standard Error Observations (Intercept) wrist 0.6492 0.4214 Et 0.4021 4.9094 32 Coefficients Standard Error 36.891 7.64 4.9732 Round answers to 4 decimal places. a) Write the equation of best-fit line. y = 36.891 +4.9732 x t-Stat P-value 4.8287 4.0E-5 1.0639 4.6743 6.0E-5 0° DOLL

Glencoe Algebra 1, Student Edition, 9780079039897, 0079039898, 2018
18th Edition
ISBN:9780079039897
Author:Carter
Publisher:Carter
Chapter4: Equations Of Linear Functions
Section4.6: Regression And Median-fit Lines
Problem 17HP

Related questions
Question
Transcribed Image Text:octorio Practice...
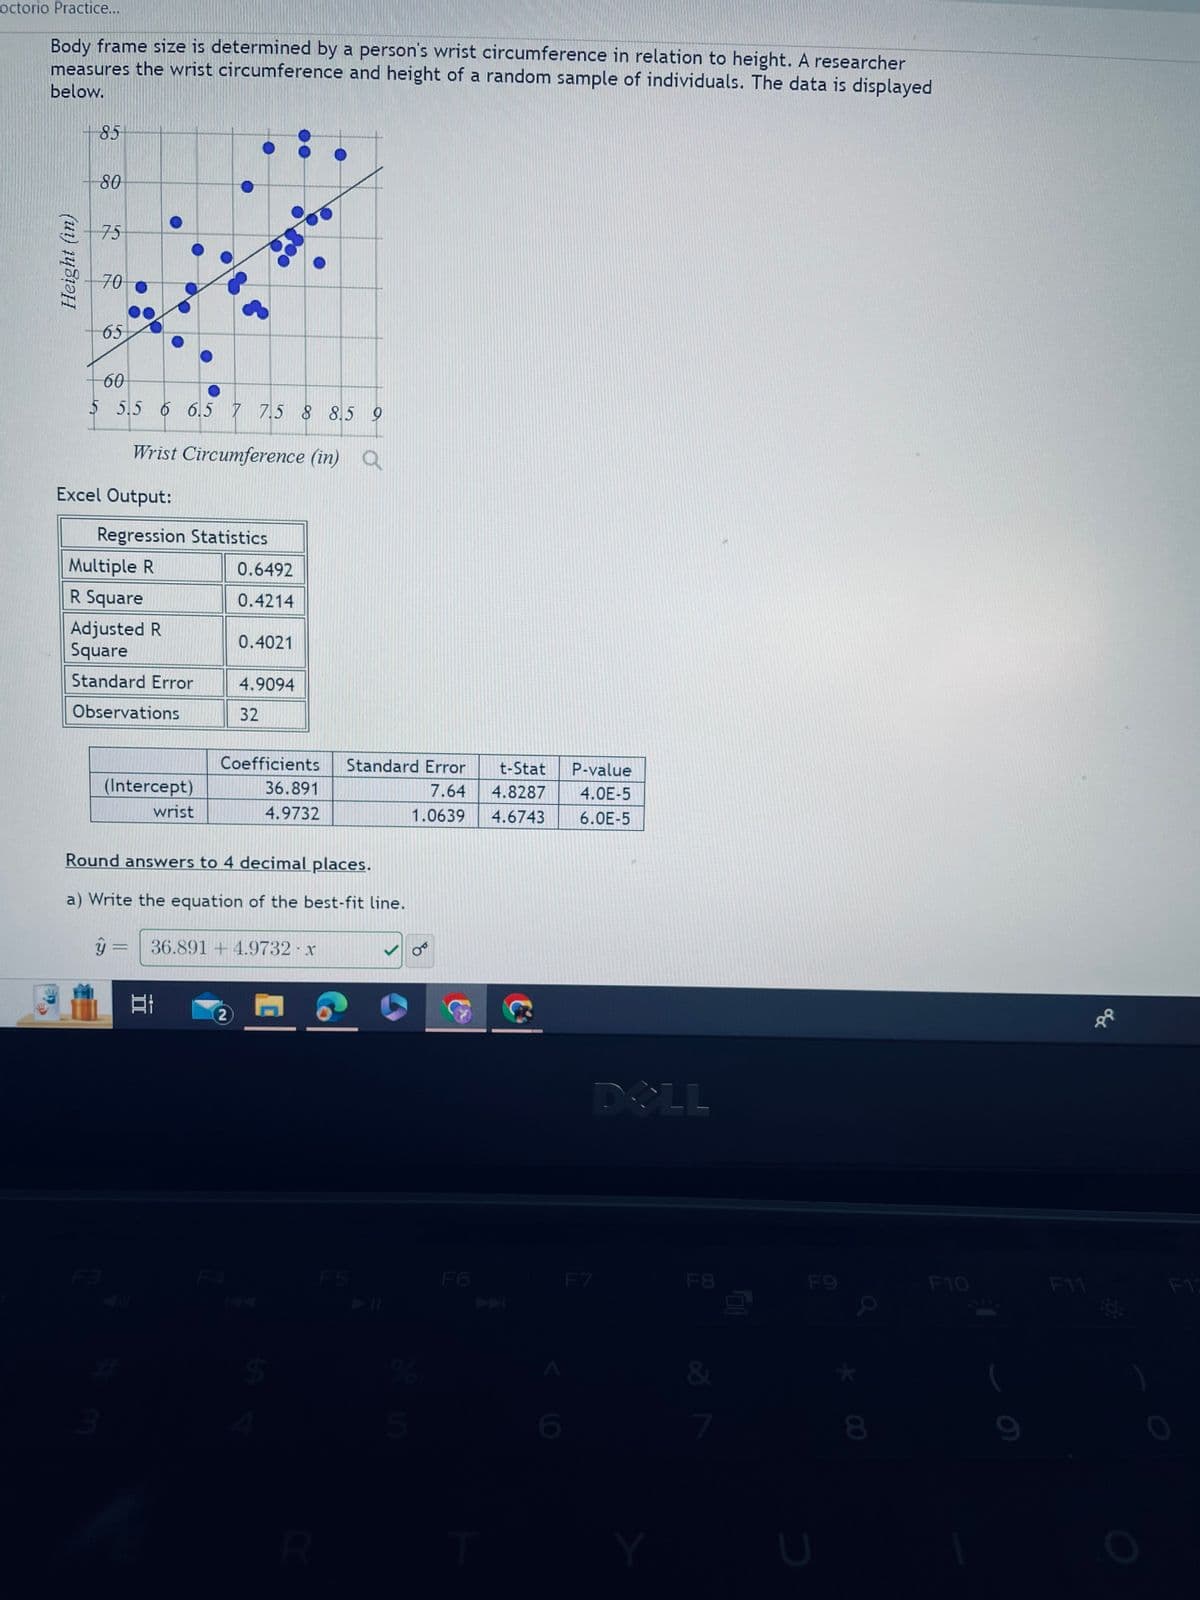
Body frame size is determined by a person's wrist circumference in relation to height. A researcher
measures the wrist circumference and height of a random sample of individuals. The data is displayed
below.
Height (in)
+85
80
75
70
65
60
5 5.5 6 6.5 7 7.5 8 8.5 9
Wrist Circumference (in) Q
Excel Output:
Regression Statistics
Multiple R
R Square
Adjusted R
Square
Standard Error
Observations
(Intercept)
wrist
Y =
0.6492
0.4214
Et
0.4021
Round answers to 4 decimal places.
a) Write the equation of the best-fit line.
4.9094
32
Coefficients Standard Error
36.891
7.64
4.9732
2
36.891 +4.9732-x
SA S
t-Stat P-value
4.8287 4.0E-5
1.0639 4.6743 6.0E-5
OP
F6
DOLL
F7
F8
&
F9
U
8
F10
F13
Transcribed Image Text:S
ces
rces
roctor
search
(Intercept)
wrist
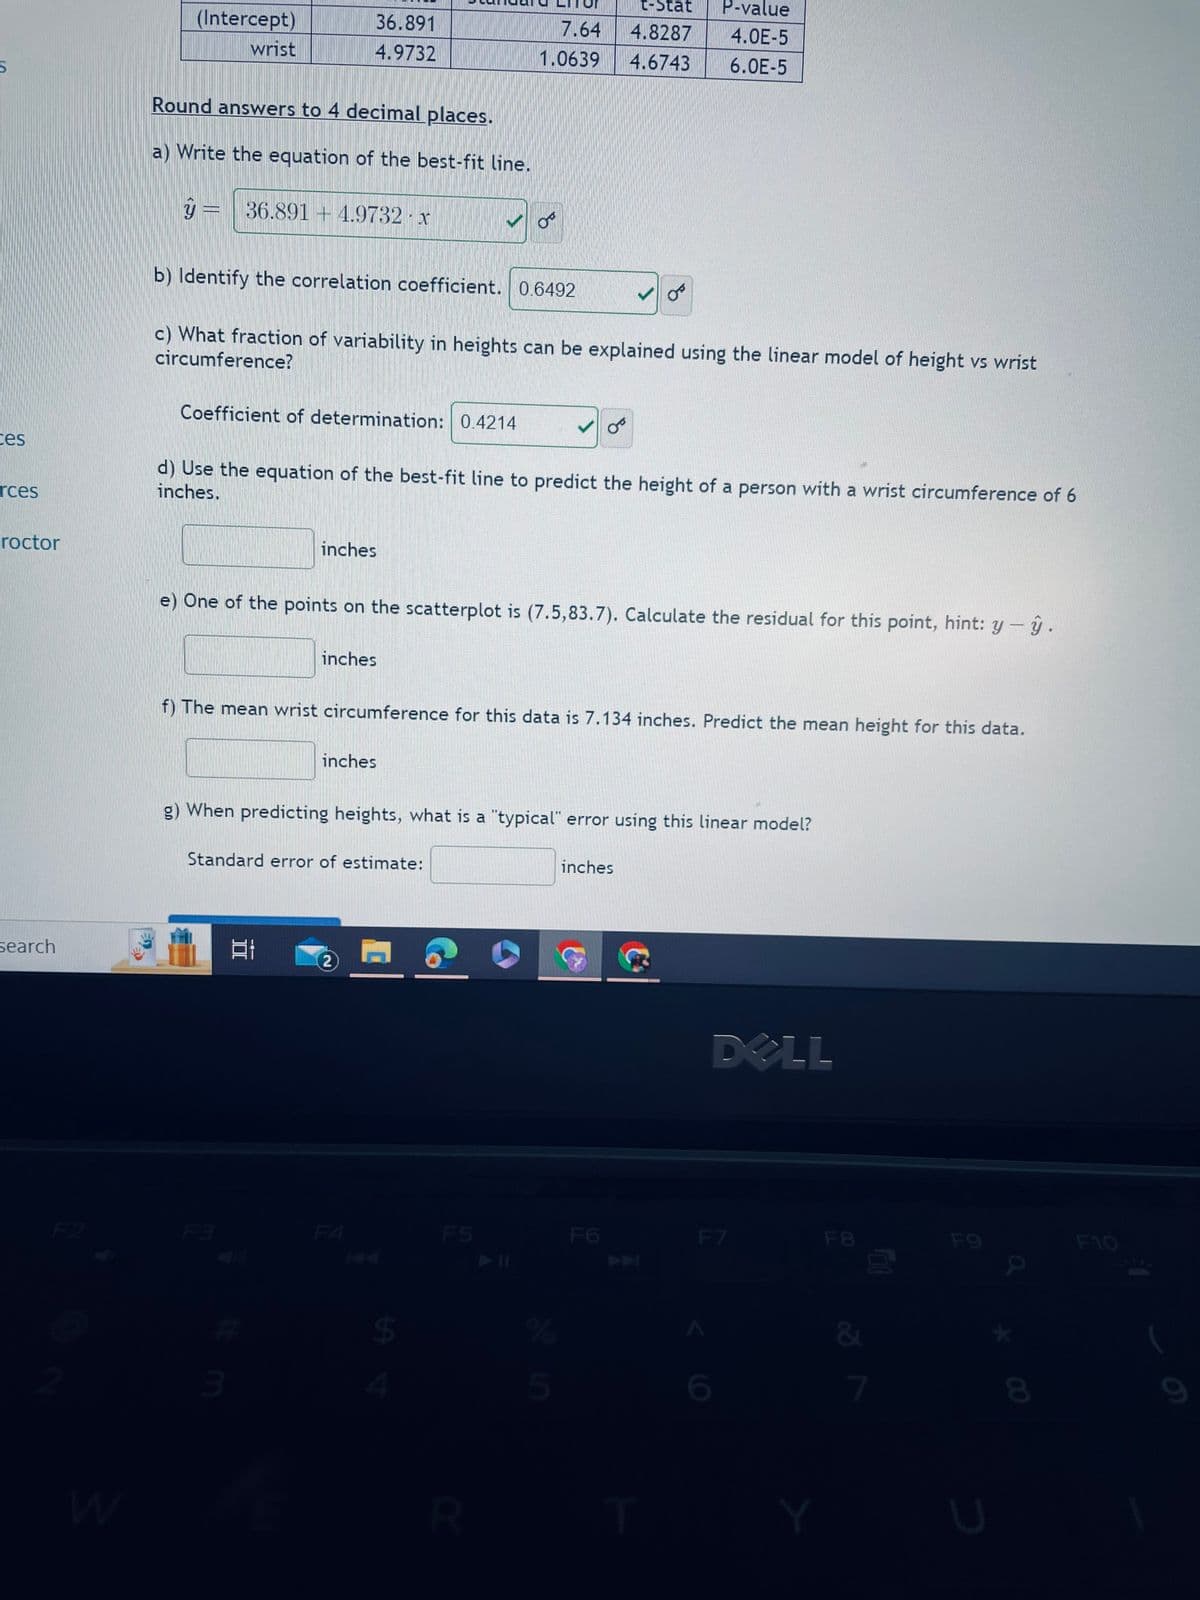
Round answers to 4 decimal places.
a) Write the equation of the best-fit line.
y = 36.891 +4.9732 x
36.891
4.9732
b) Identify the correlation coefficient. 0.6492
Coefficient of determination: 0.4214
c) What fraction of variability in heights can be explained using the linear model of height vs wrist
circumference?
inches
d) Use the equation of the best-fit line to predict the height of a person with a wrist circumference of 6
inches.
inches
Et
e) One of the points on the scatterplot is (7.5,83.7). Calculate the residual for this point, hint: y - y.
inches
Standard error of estimate:
7.64
1.0639
f) The mean wrist circumference for this data is 7.134 inches. Predict the mean height for this data.
2
OF
g) When predicting heights, what is a "typical" error using this linear model?
A
LA
F5
R
0°
t-Stat
P-value
4.8287 4.0E-5
4.6743
6.0E-5
%
5
inches
F6
DELL
F7
F8
&
F9
9
8
F10
9
Expert Solution
This question has been solved!
Explore an expertly crafted, step-by-step solution for a thorough understanding of key concepts.

This is a popular solution!

Trending now
This is a popular solution!

Step by step
Solved in 5 steps with 4 images

Recommended textbooks for you
Glencoe Algebra 1, Student Edition, 9780079039897…
Algebra
ISBN:
9780079039897
Author:
Carter
Publisher:
McGraw Hill

Big Ideas Math A Bridge To Success Algebra 1: Stu…
Algebra
ISBN:
9781680331141
Author:
HOUGHTON MIFFLIN HARCOURT
Publisher:
Houghton Mifflin Harcourt
Glencoe Algebra 1, Student Edition, 9780079039897…
Algebra
ISBN:
9780079039897
Author:
Carter
Publisher:
McGraw Hill
Big Ideas Math A Bridge To Success Algebra 1: Stu…
Algebra
ISBN:
9781680331141
Author:
HOUGHTON MIFFLIN HARCOURT
Publisher:
Houghton Mifflin Harcourt