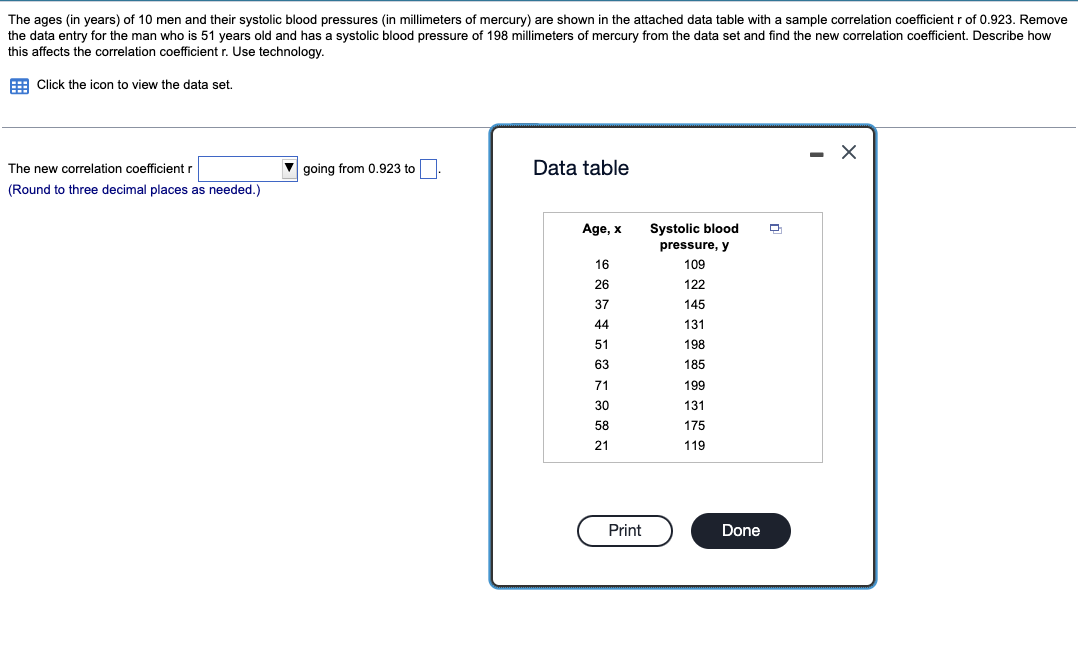
The ages (in years) of 10 men and their systolic blood pressures (in millimeters of mercury) are shown in the attached data table with a sample correlation coefficient r of 0.923. Remove the data entry for the man who is 51 years old and has a systolic blood pressure of 198 millimeters of mercury from the data set and find the new correlation coefficient. Describe how this affects the correlation coefficient r. Use technology. E Click the icon to view the data set. The new correlation coefficient r V going from 0.923 to Data table (Round to three decimal places as needed.) Age, x Systolic blood pressure, y 16 109 26 122 37 145 44 131 51 198 63 185 71 199 30 131 58 175 21 119
The ages (in years) of 10 men and their systolic blood pressures (in millimeters of mercury) are shown in the attached data table with a sample correlation coefficient r of 0.923. Remove the data entry for the man who is 51 years old and has a systolic blood pressure of 198 millimeters of mercury from the data set and find the new correlation coefficient. Describe how this affects the correlation coefficient r. Use technology. E Click the icon to view the data set. The new correlation coefficient r V going from 0.923 to Data table (Round to three decimal places as needed.) Age, x Systolic blood pressure, y 16 109 26 122 37 145 44 131 51 198 63 185 71 199 30 131 58 175 21 119

Glencoe Algebra 1, Student Edition, 9780079039897, 0079039898, 2018
18th Edition
ISBN:9780079039897
Author:Carter
Publisher:Carter
Chapter4: Equations Of Linear Functions
Section4.5: Correlation And Causation
Problem 15PPS

Related questions
Question
Transcribed Image Text:The ages (in years) of 10 men and their systolic blood pressures (in millimeters of mercury) are shown in the attached data table with a sample correlation coefficient r of 0.923. Remove
the data entry for the man who is 51 years old and has
this affects the correlation coefficient r. Use technology.
systolic blood pressure of 198 millimeters of mercury from the data set and find the new correlation coefficient. Describe how
E Click the icon to view the data set.
The new correlation coefficient r
going from 0.923 to
Data table
(Round to three decimal places as needed.)
Age, x
Systolic blood
pressure, y
16
109
26
122
37
145
44
131
51
198
63
185
71
199
30
131
58
175
21
119
Print
Done
Expert Solution
This question has been solved!
Explore an expertly crafted, step-by-step solution for a thorough understanding of key concepts.

This is a popular solution!

Trending now
This is a popular solution!

Step by step
Solved in 2 steps with 1 images

Recommended textbooks for you
Glencoe Algebra 1, Student Edition, 9780079039897…
Algebra
ISBN:
9780079039897
Author:
Carter
Publisher:
McGraw Hill

Big Ideas Math A Bridge To Success Algebra 1: Stu…
Algebra
ISBN:
9781680331141
Author:
HOUGHTON MIFFLIN HARCOURT
Publisher:
Houghton Mifflin Harcourt

Holt Mcdougal Larson Pre-algebra: Student Edition…
Algebra
ISBN:
9780547587776
Author:
HOLT MCDOUGAL
Publisher:
HOLT MCDOUGAL
Glencoe Algebra 1, Student Edition, 9780079039897…
Algebra
ISBN:
9780079039897
Author:
Carter
Publisher:
McGraw Hill
Big Ideas Math A Bridge To Success Algebra 1: Stu…
Algebra
ISBN:
9781680331141
Author:
HOUGHTON MIFFLIN HARCOURT
Publisher:
Houghton Mifflin Harcourt
Holt Mcdougal Larson Pre-algebra: Student Edition…
Algebra
ISBN:
9780547587776
Author:
HOLT MCDOUGAL
Publisher:
HOLT MCDOUGAL