An article in the Journal of Sound and Vibration (Vol. 151, 1991, pp. 383-394) described a study investigating the relationship between noit exposure and hypertension. The following data are representative of those reported in the article. 1 60 5 85 0 63 4 89 1 65 6 90 2 70 8 90 5 70 4 90 1 70 5 90 4 80 7 94 6 90 9 100 2 60 7 100 3 80 6 100 Fita inear regression model relating blood pressure rise in millimeters of mercury (r) to sound pressure level in decibels (x) uning least squares. Does a simple linear regression model (slope) seem reasonable in this situation? Input Yes or No. Blank 1 What are the least squares estimate of the slope? Input answer up to 3 decimal places, i.e., 0.000. Blank 2 Blank 1 Add your answer Blank 2 Add your answer
An article in the Journal of Sound and Vibration (Vol. 151, 1991, pp. 383-394) described a study investigating the relationship between noit exposure and hypertension. The following data are representative of those reported in the article. 1 60 5 85 0 63 4 89 1 65 6 90 2 70 8 90 5 70 4 90 1 70 5 90 4 80 7 94 6 90 9 100 2 60 7 100 3 80 6 100 Fita inear regression model relating blood pressure rise in millimeters of mercury (r) to sound pressure level in decibels (x) uning least squares. Does a simple linear regression model (slope) seem reasonable in this situation? Input Yes or No. Blank 1 What are the least squares estimate of the slope? Input answer up to 3 decimal places, i.e., 0.000. Blank 2 Blank 1 Add your answer Blank 2 Add your answer

College Algebra
7th Edition
ISBN:9781305115545
Author:James Stewart, Lothar Redlin, Saleem Watson
Publisher:James Stewart, Lothar Redlin, Saleem Watson
Chapter1: Equations And Graphs
Section: Chapter Questions
Problem 10T: Olympic Pole Vault The graph in Figure 7 indicates that in recent years the winning Olympic men’s...

Related questions
Question
Transcribed Image Text:Question 7
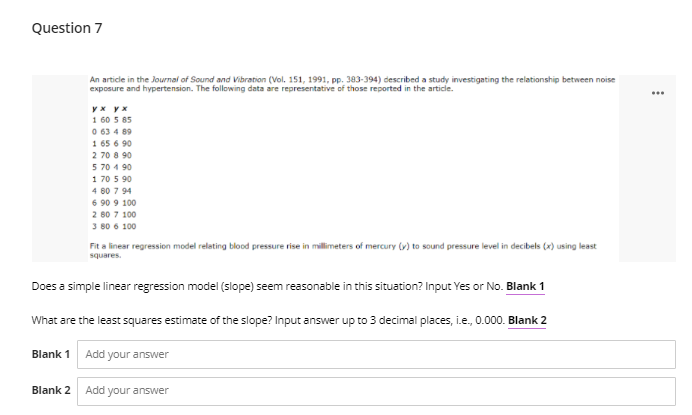
An article in the Journal of Sound and Vibration (Vol. 151, 1991, pp. 383-394) described a study investigating the relationship between noise
exposure and hypertension. The following data are representative of those reported in the article.
1 60 5 85
0 63 4 89
1 65 6 90
2 70 8 90
5 70 4 90
1 70 5 90
4 80 7 94
6 90 9 100
2 80 7 100
3 80 6 100
Fit a linear regression model relating blood pressure rise in millimeters of mercury (v) to sound pressure level in decibels (x) using least
squares.
Does a simple linear regression model (slope) seem reasonable in this situation? Input Yes or No. Blank 1
What are the least squares estimate of the slope? Input answer up to 3 decimal places, i.e., 0.000. Blank 2
Blank 1
Add your answer
Blank 2
Add your answer
Expert Solution
This question has been solved!
Explore an expertly crafted, step-by-step solution for a thorough understanding of key concepts.

Step by step
Solved in 2 steps with 2 images

Recommended textbooks for you
College Algebra
Algebra
ISBN:
9781305115545
Author:
James Stewart, Lothar Redlin, Saleem Watson
Publisher:
Cengage Learning

Elementary Linear Algebra (MindTap Course List)
Algebra
ISBN:
9781305658004
Author:
Ron Larson
Publisher:
Cengage Learning

Functions and Change: A Modeling Approach to Coll…
Algebra
ISBN:
9781337111348
Author:
Bruce Crauder, Benny Evans, Alan Noell
Publisher:
Cengage Learning
College Algebra
Algebra
ISBN:
9781305115545
Author:
James Stewart, Lothar Redlin, Saleem Watson
Publisher:
Cengage Learning
Elementary Linear Algebra (MindTap Course List)
Algebra
ISBN:
9781305658004
Author:
Ron Larson
Publisher:
Cengage Learning
Functions and Change: A Modeling Approach to Coll…
Algebra
ISBN:
9781337111348
Author:
Bruce Crauder, Benny Evans, Alan Noell
Publisher:
Cengage Learning