The aim is to investigate the influence of the carbon content C. [%] (C, C2) and the casting temperature T ra T. T. T and Taàto have the number of defective parts in a mold. The following ANOVA table was calculated (significance level 5%). Indicate what type of analysis of variance it is. Explain your decision. Test the given hypotheses and interpret the results. Specify the effect sizes. ANOVA table: Causes of dispersion Sums of squares df P value Carbon content 0.43 0.7181 Casting temperature 56.04 3 0.0187 interaction 22.78 0.0405 failure 97.82 32 total 177.07 39 Name of the test procedure: O One-way analysis of variance with repeated measurements O Two-factor analysis of variance without repetition of measurements O Two-factor analysis of variance with repeated measures O h-test according to Kruskal and Wallis Reason: O There are three influencing factors O There are two influencing factors and how they interact O The ANOVA table lists the error hypothesis H3 discard: Interpretation: O There are no very significant errors O There are significant interactions O There are very significant interactions
The aim is to investigate the influence of the carbon content C. [%] (C, C2) and the casting temperature T ra T. T. T and Taàto have the number of defective parts in a mold. The following ANOVA table was calculated (significance level 5%). Indicate what type of analysis of variance it is. Explain your decision. Test the given hypotheses and interpret the results. Specify the effect sizes. ANOVA table: Causes of dispersion Sums of squares df P value Carbon content 0.43 0.7181 Casting temperature 56.04 3 0.0187 interaction 22.78 0.0405 failure 97.82 32 total 177.07 39 Name of the test procedure: O One-way analysis of variance with repeated measurements O Two-factor analysis of variance without repetition of measurements O Two-factor analysis of variance with repeated measures O h-test according to Kruskal and Wallis Reason: O There are three influencing factors O There are two influencing factors and how they interact O The ANOVA table lists the error hypothesis H3 discard: Interpretation: O There are no very significant errors O There are significant interactions O There are very significant interactions

Functions and Change: A Modeling Approach to College Algebra (MindTap Course List)
6th Edition
ISBN:9781337111348
Author:Bruce Crauder, Benny Evans, Alan Noell
Publisher:Bruce Crauder, Benny Evans, Alan Noell
Chapter5: A Survey Of Other Common Functions
Section5.6: Higher-degree Polynomials And Rational Functions
Problem 5E: Population Genetics In the study of population genetics, an important measure of inbreeding is the...

Related questions
Question
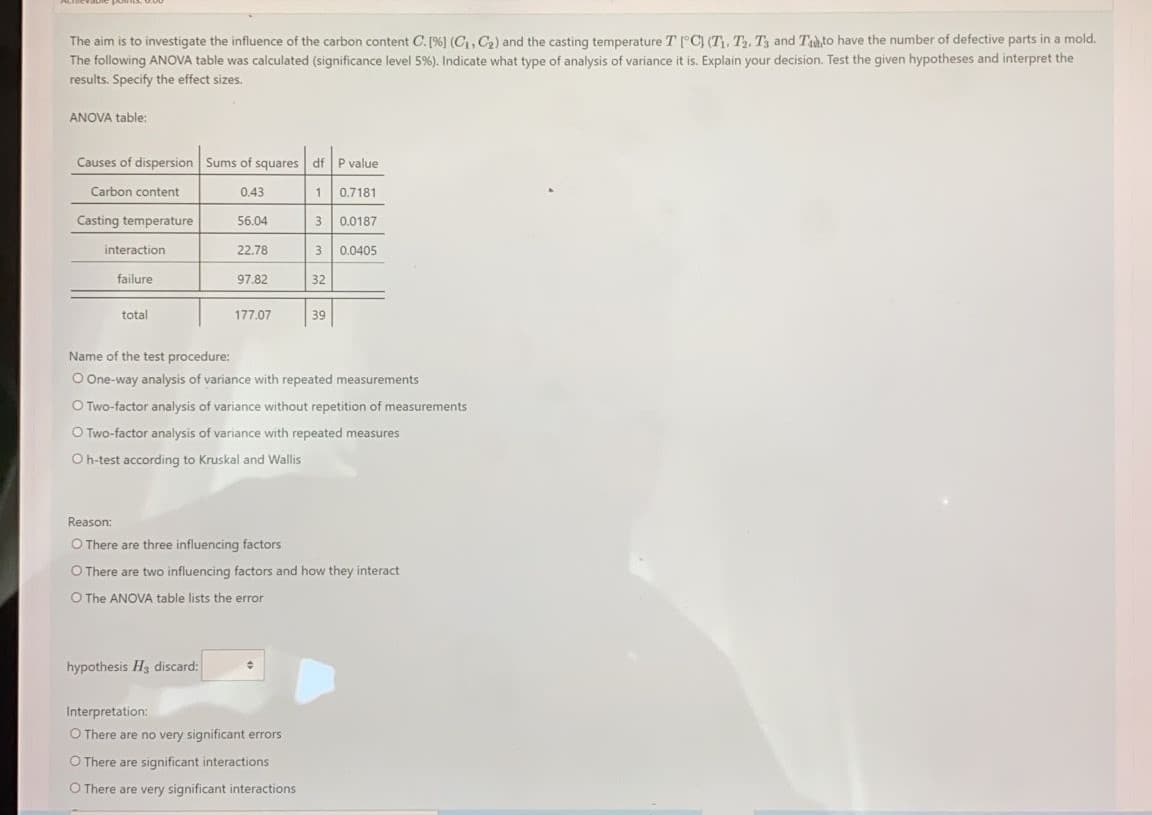
Transcribed Image Text:The aim is to investigate the influence of the carbon content C. [%) (C, C,) and the casting temperature T [°C) (T), T, Tỷ and Tuhto have the number of defective parts in a mold.
The following ANOVA table was calculated (significance level 5%). Indicate what type of analysis of variance it is. Explain your decision. Test the given hypotheses and interpret the
results. Specify the effect sizes.
ANOVA table:
Causes of dispersion Sums of squares dfP value
Carbon content
0.43
0.7181
Casting temperature
56.04
0.0187
interaction
22.78
3 0.0405
failure
97.82
32
total
177.07
39
Name of the test procedure:
O One-way analysis of variance with repeated measurements
O Two-factor analysis of variance without repetition of measurements
O Two-factor analysis of variance with repeated measures
O h-test according to Kruskal and Wallis
Reason:
O There are three influencing factors
O There are two influencing factors and how they interact
O The ANOVA table lists the error
hypothesis H3 discard:
Interpretation:
O There are no very significant errors
O There are significant interactions
O There are very significant interactions
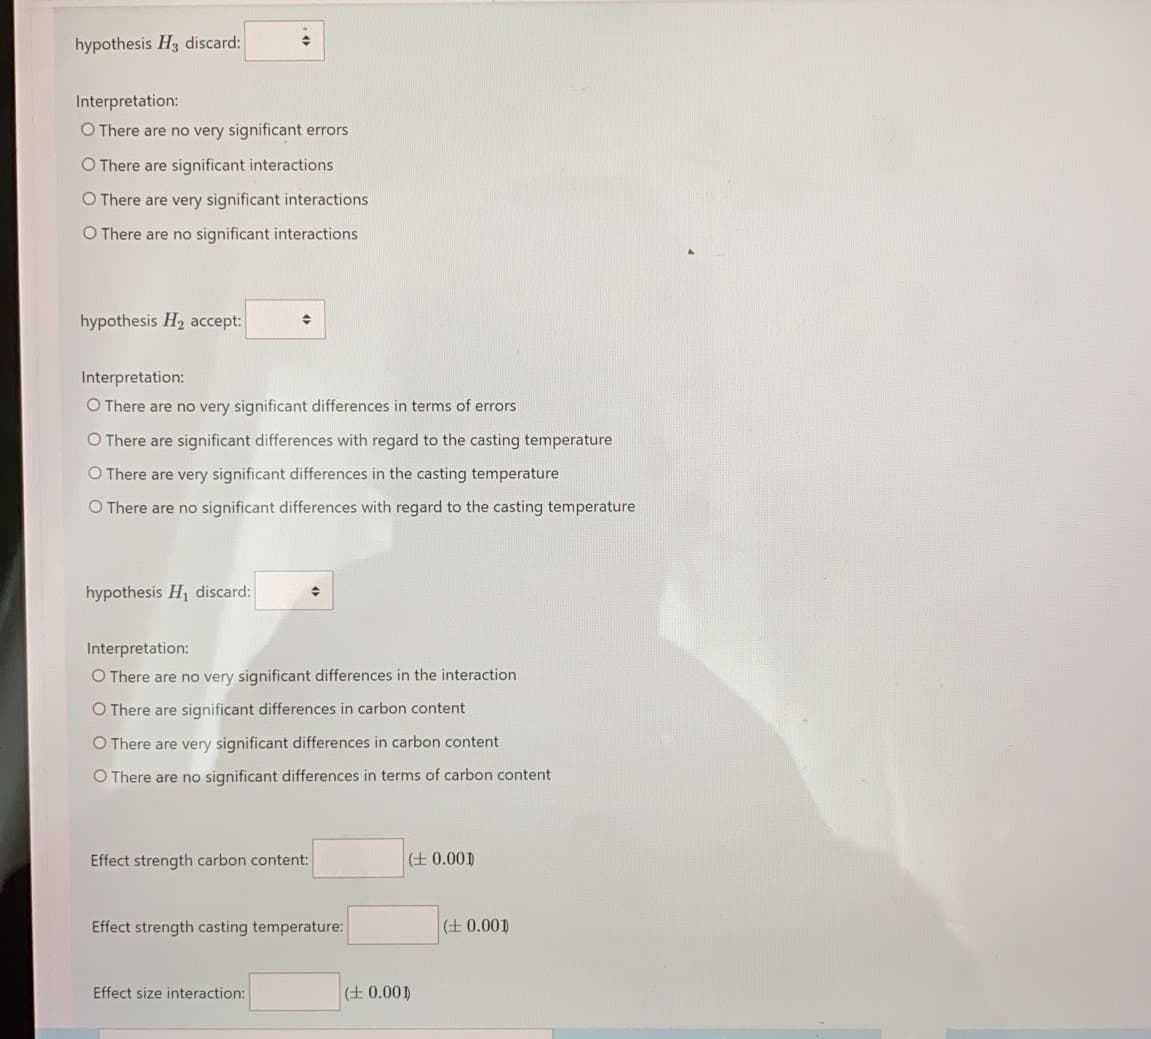
Transcribed Image Text:hypothesis H3 discard:
Interpretation:
O There are no very significant errors
O There are significant interactions
O There are very significant interactions
O There are no significant interactions
hypothesis H2 accept:
Interpretation:
O There are no very significant differences in terms of errors
O There are significant differences with regard to the casting temperature
O There are very significant differences in the casting temperature
O There are no significant differences with regard to the casting temperature
hypothesis H1 discard:
Interpretation:
O There are no very significant differences in the interaction
O There are significant differences in carbon content
O There are very significant differences in carbon content
O There are no significant differences in terms of carbon content
Effect strength carbon content:
(土0.001
Effect strength casting temperature:
(土0.00)
Effect size interaction:
(土0.00)
Expert Solution
This question has been solved!
Explore an expertly crafted, step-by-step solution for a thorough understanding of key concepts.

Step by step
Solved in 2 steps with 5 images

Knowledge Booster


Learn more about
Need a deep-dive on the concept behind this application? Look no further. Learn more about this topic, statistics and related others by exploring similar questions and additional content below.Recommended textbooks for you
Functions and Change: A Modeling Approach to Coll…
Algebra
ISBN:
9781337111348
Author:
Bruce Crauder, Benny Evans, Alan Noell
Publisher:
Cengage Learning

Functions and Change: A Modeling Approach to Coll…
Algebra
ISBN:
9781337111348
Author:
Bruce Crauder, Benny Evans, Alan Noell
Publisher:
Cengage Learning