The amount of time adults spend watching television is closely monitored by firms because this helps to determine advertising pricing for commercials. Complete parts (a) through (d). (a) Do you think the variable "weekly time spent watching television" would be normally distributed? If not, what shape would you expect the variable to have? A. The variable "weekly time spent watching television" is likely normally distributed. B. The variable "weekly time spent watching television" is likely symmetric, but not normally distributed. C. The variable "weekly time spent watching television" is likely uniform, not normally distributed. D. The variable "weekly time spent watching television" is likely skewed right, not normally distributed. E. The variable "weekly time spent watching television" is likely skewed left, not normally distributed. (b) According to a certain survey, adults spend 2.35 hours per day watching television on a weekday. Assume that the standard deviation for "time spent watching television on a weekday" is 1.93 hours. If a random sample of 40 adults is obtained, describe the sampling distribution of x, the mean amount of time spent watching television on a weekday. x is approximately normal with H = 2.35 and o; = (Round to six decimal places as needed.) (c) Determine the probability that a random sample of 40 adults results in a mean time watching television on a weekday of between 2 and 3 hours. The probability is. (Round to four decimal places as needed.)
The amount of time adults spend watching television is closely monitored by firms because this helps to determine advertising pricing for commercials. Complete parts (a) through (d). (a) Do you think the variable "weekly time spent watching television" would be normally distributed? If not, what shape would you expect the variable to have? A. The variable "weekly time spent watching television" is likely normally distributed. B. The variable "weekly time spent watching television" is likely symmetric, but not normally distributed. C. The variable "weekly time spent watching television" is likely uniform, not normally distributed. D. The variable "weekly time spent watching television" is likely skewed right, not normally distributed. E. The variable "weekly time spent watching television" is likely skewed left, not normally distributed. (b) According to a certain survey, adults spend 2.35 hours per day watching television on a weekday. Assume that the standard deviation for "time spent watching television on a weekday" is 1.93 hours. If a random sample of 40 adults is obtained, describe the sampling distribution of x, the mean amount of time spent watching television on a weekday. x is approximately normal with H = 2.35 and o; = (Round to six decimal places as needed.) (c) Determine the probability that a random sample of 40 adults results in a mean time watching television on a weekday of between 2 and 3 hours. The probability is. (Round to four decimal places as needed.)

Algebra & Trigonometry with Analytic Geometry
13th Edition
ISBN:9781133382119
Author:Swokowski
Publisher:Swokowski
Chapter7: Analytic Trigonometry
Section7.6: The Inverse Trigonometric Functions
Problem 94E

Related questions
Question
Transcribed Image Text:The amount of time adults spend watching television is closely monitored by firms because this helps to determine advertising pricing for commercials. Complete parts (a) through (d).
.....
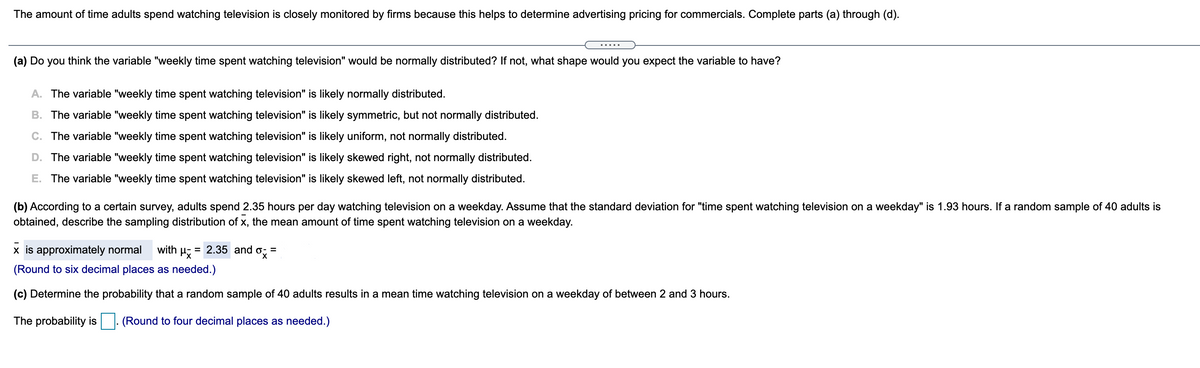
(a) Do you think the variable "weekly time spent watching television" would be normally distributed? If not, what shape would you expect the variable to have?
A. The variable "weekly time spent watching television" is likely normally distributed.
B. The variable "weekly time spent watching television" is likely symmetric, but not normally distributed.
C. The variable "weekly time spent watching television" is likely uniform, not normally distributed.
D. The variable "weekly time spent watching television" is likely skewed right, not normally distributed.
E. The variable "weekly time spent watching television" is likely skewed left, not normally distributed.
(b) According to a certain survey, adults spend 2.35 hours per day watching television on a weekday. Assume that the standard deviation for "time spent watching television on a weekday" is 1.93 hours. If a random sample of 40 adults is
obtained, describe the sampling distribution of x, the mean amount of time spent watching television on a weekday.
x is approximately normal
with
= 2.35 and
=
(Round to six decimal places as needed.)
(c) Determine the probability that a random sample of 40 adults results in a mean time watching television on a weekday of between 2 and 3 hours.
The probability is
. (Round to four decimal places as needed.)
Expert Solution
This question has been solved!
Explore an expertly crafted, step-by-step solution for a thorough understanding of key concepts.

This is a popular solution!

Trending now
This is a popular solution!

Step by step
Solved in 2 steps with 1 images

Recommended textbooks for you
Algebra & Trigonometry with Analytic Geometry
Algebra
ISBN:
9781133382119
Author:
Swokowski
Publisher:
Cengage

Linear Algebra: A Modern Introduction
Algebra
ISBN:
9781285463247
Author:
David Poole
Publisher:
Cengage Learning

Algebra and Trigonometry (MindTap Course List)
Algebra
ISBN:
9781305071742
Author:
James Stewart, Lothar Redlin, Saleem Watson
Publisher:
Cengage Learning
Algebra & Trigonometry with Analytic Geometry
Algebra
ISBN:
9781133382119
Author:
Swokowski
Publisher:
Cengage
Linear Algebra: A Modern Introduction
Algebra
ISBN:
9781285463247
Author:
David Poole
Publisher:
Cengage Learning
Algebra and Trigonometry (MindTap Course List)
Algebra
ISBN:
9781305071742
Author:
James Stewart, Lothar Redlin, Saleem Watson
Publisher:
Cengage Learning

Glencoe Algebra 1, Student Edition, 9780079039897…
Algebra
ISBN:
9780079039897
Author:
Carter
Publisher:
McGraw Hill

Holt Mcdougal Larson Pre-algebra: Student Edition…
Algebra
ISBN:
9780547587776
Author:
HOLT MCDOUGAL
Publisher:
HOLT MCDOUGAL

Functions and Change: A Modeling Approach to Coll…
Algebra
ISBN:
9781337111348
Author:
Bruce Crauder, Benny Evans, Alan Noell
Publisher:
Cengage Learning