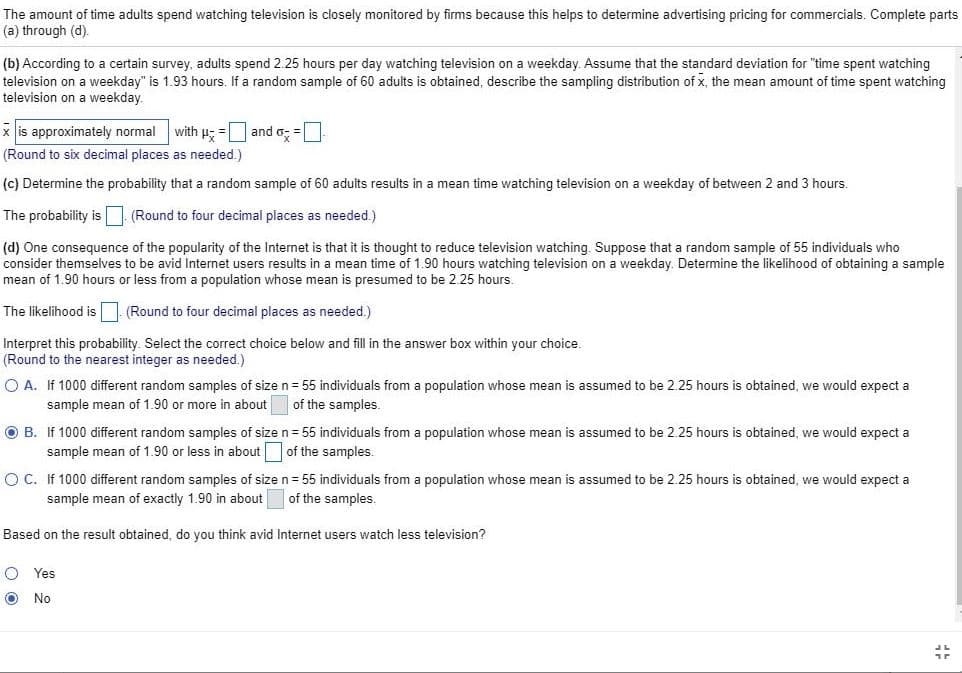
The amount of time adults spend watching television is closely monitored by firms because this helps to determine advertising pricing for commercials. Complete parts (a) through (d). (b) According to a certain survey, adults spend 2.25 hours per day watching television on a weekday. Assume that the standard deviation for "time spent watching television on a weekday" is 1.93 hours. If a random sample of 60 adults is obtained, describe the sampling distribution of x, the mean amount of time spent watching television on a weekday. x is approximately normal with p; = and o; = (Round to six decimal places as needed.) (c) Determine the probability that a random sample of 60 adults results in a mean time watching television on a weekday of between 2 and 3 hours. The probability is (Round to four decimal places as needed.) (d) One consequence of the popularity of the Internet is that it is thought to reduce television watching. Suppose that a random sample of 55 individuals who consider themselves to be avid Internet users results in a mean time of 1.90 hours watching television on a weekday. Determine the likelihood of obtaining a sample mean of 1.90 hours or less from a population whose mean is presumed to be 2.25 hours. The likelihood is (Round to four decimal places as needed.) Interpret this probability. Select the correct choice below and fill in the answer box within your choice. (Round to the nearest integer as needed.) O A. If 1000 different random samples of sizen = 55 individuals from a population whose mean is assumed to be 2.25 hours is obtained, we would expect a sample mean of 1.90 or more in about of the samples. O B. If 1000 different random samples of sizen= 55 individuals from a population whose mean is assumed to be 2.25 hours is obtained, we would expect a sample mean of 1.90 or less in about of the samples. O C. If 1000 different random samples of sizen= 55 individuals from a population whose mean is assumed to be 2.25 hours is obtained, we would expect a sample mean of exactly 1.90 in about of the samples. Based on the result obtained, do you think avid Internet users watch less television? O Yes O No
The amount of time adults spend watching television is closely monitored by firms because this helps to determine advertising pricing for commercials. Complete parts (a) through (d). (b) According to a certain survey, adults spend 2.25 hours per day watching television on a weekday. Assume that the standard deviation for "time spent watching television on a weekday" is 1.93 hours. If a random sample of 60 adults is obtained, describe the sampling distribution of x, the mean amount of time spent watching television on a weekday. x is approximately normal with p; = and o; = (Round to six decimal places as needed.) (c) Determine the probability that a random sample of 60 adults results in a mean time watching television on a weekday of between 2 and 3 hours. The probability is (Round to four decimal places as needed.) (d) One consequence of the popularity of the Internet is that it is thought to reduce television watching. Suppose that a random sample of 55 individuals who consider themselves to be avid Internet users results in a mean time of 1.90 hours watching television on a weekday. Determine the likelihood of obtaining a sample mean of 1.90 hours or less from a population whose mean is presumed to be 2.25 hours. The likelihood is (Round to four decimal places as needed.) Interpret this probability. Select the correct choice below and fill in the answer box within your choice. (Round to the nearest integer as needed.) O A. If 1000 different random samples of sizen = 55 individuals from a population whose mean is assumed to be 2.25 hours is obtained, we would expect a sample mean of 1.90 or more in about of the samples. O B. If 1000 different random samples of sizen= 55 individuals from a population whose mean is assumed to be 2.25 hours is obtained, we would expect a sample mean of 1.90 or less in about of the samples. O C. If 1000 different random samples of sizen= 55 individuals from a population whose mean is assumed to be 2.25 hours is obtained, we would expect a sample mean of exactly 1.90 in about of the samples. Based on the result obtained, do you think avid Internet users watch less television? O Yes O No

MATLAB: An Introduction with Applications
6th Edition
ISBN:9781119256830
Author:Amos Gilat
Publisher:Amos Gilat
Chapter1: Starting With Matlab
Section: Chapter Questions
Problem 1P

Related questions
Question
Transcribed Image Text:The amount of time adults spend watching television is closely monitored by firms because this helps to determine advertising pricing for commercials. Complete parts
(a) through (d).
(b) According to a certain survey, adults spend 2.25 hours per day watching television on a weekday. Assume that the standard deviation for "time spent watching
television on a weekday" is 1.93 hours. If a random sample of 60 adults is obtained, describe the sampling distribution of x, the mean amount of time spent watching
television on a weekday.
x is approximately normal
with p; = and o; =
(Round to six decimal places as needed.)
(c) Determine the probability that a random sample of 60 adults results in a mean time watching television on a weekday of between 2 and 3 hours.
The probability is (Round to four decimal places as needed.)
(d) One consequence of the popularity of the Internet is that it is thought to reduce television watching. Suppose that a random sample of 55 individuals who
consider themselves to be avid Internet users results in a mean time of 1.90 hours watching television on a weekday. Determine the likelihood of obtaining a sample
mean of 1.90 hours or less from a population whose mean is presumed to be 2.25 hours.
The likelihood is
(Round to four decimal places as needed.)
Interpret this probability. Select the correct choice below and fill in the answer box within your choice.
(Round to the nearest integer as needed.)
O A. If 1000 different random samples of sizen = 55 individuals from a population whose mean is assumed to be 2.25 hours is obtained, we would expect a
sample mean of 1.90 or more in about
of the samples.
O B. If 1000 different random samples of sizen= 55 individuals from a population whose mean is assumed to be 2.25 hours is obtained, we would expect a
sample mean of 1.90 or less in about
of the samples.
O C. If 1000 different random samples of sizen= 55 individuals from a population whose mean is assumed to be 2.25 hours is obtained, we would expect a
sample mean of exactly 1.90 in about
of the samples.
Based on the result obtained, do you think avid Internet users watch less television?
O Yes
O No
Expert Solution
This question has been solved!
Explore an expertly crafted, step-by-step solution for a thorough understanding of key concepts.

This is a popular solution!

Trending now
This is a popular solution!

Step by step
Solved in 3 steps with 3 images

Recommended textbooks for you
MATLAB: An Introduction with Applications
Statistics
ISBN:
9781119256830
Author:
Amos Gilat
Publisher:
John Wiley & Sons Inc

Probability and Statistics for Engineering and th…
Statistics
ISBN:
9781305251809
Author:
Jay L. Devore
Publisher:
Cengage Learning

Statistics for The Behavioral Sciences (MindTap C…
Statistics
ISBN:
9781305504912
Author:
Frederick J Gravetter, Larry B. Wallnau
Publisher:
Cengage Learning
MATLAB: An Introduction with Applications
Statistics
ISBN:
9781119256830
Author:
Amos Gilat
Publisher:
John Wiley & Sons Inc
Probability and Statistics for Engineering and th…
Statistics
ISBN:
9781305251809
Author:
Jay L. Devore
Publisher:
Cengage Learning
Statistics for The Behavioral Sciences (MindTap C…
Statistics
ISBN:
9781305504912
Author:
Frederick J Gravetter, Larry B. Wallnau
Publisher:
Cengage Learning

Elementary Statistics: Picturing the World (7th E…
Statistics
ISBN:
9780134683416
Author:
Ron Larson, Betsy Farber
Publisher:
PEARSON

The Basic Practice of Statistics
Statistics
ISBN:
9781319042578
Author:
David S. Moore, William I. Notz, Michael A. Fligner
Publisher:
W. H. Freeman

Introduction to the Practice of Statistics
Statistics
ISBN:
9781319013387
Author:
David S. Moore, George P. McCabe, Bruce A. Craig
Publisher:
W. H. Freeman