The amount of water in a bottle is approximately normally distributed with a mean of 2.50 liters with a standard deviation of 0.025 liter. Complete parts (a) through (e) below. a. What is the probability that an individual bottle contains less than 2.48 liters? 0.212 (Round to three decimal places as needed.) b. If a sample of 4 bottles is selected, what is the probability that the sample mean amount contained is less than 2.48 liters? 0.055 (Round to three decimal places as needed.) c. If a sample of 25 bottles is selected, what is the probability that the sample mean amount contained is less than 2.48 liters? 0.000 (Round to three decimal places as needed.)
The amount of water in a bottle is approximately normally distributed with a mean of 2.50 liters with a standard deviation of 0.025 liter. Complete parts (a) through (e) below. a. What is the probability that an individual bottle contains less than 2.48 liters? 0.212 (Round to three decimal places as needed.) b. If a sample of 4 bottles is selected, what is the probability that the sample mean amount contained is less than 2.48 liters? 0.055 (Round to three decimal places as needed.) c. If a sample of 25 bottles is selected, what is the probability that the sample mean amount contained is less than 2.48 liters? 0.000 (Round to three decimal places as needed.)

MATLAB: An Introduction with Applications
6th Edition
ISBN:9781119256830
Author:Amos Gilat
Publisher:Amos Gilat
Chapter1: Starting With Matlab
Section: Chapter Questions
Problem 1P

Related questions
Question
is this correct?
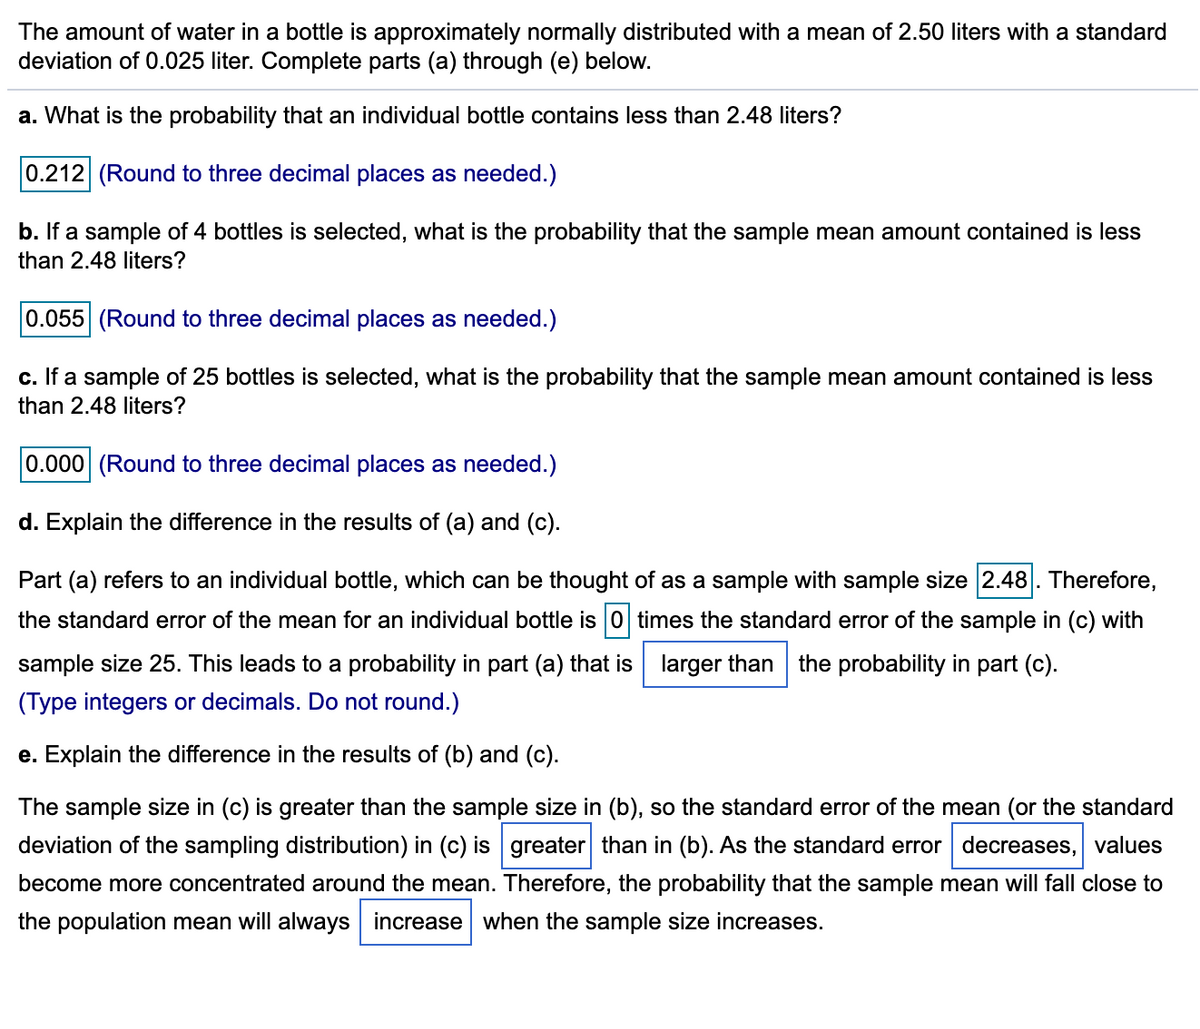
Transcribed Image Text:The amount of water in a bottle is approximately normally distributed with a mean of 2.50 liters with a standard
deviation of 0.025 liter. Complete parts (a) through (e) below.
a. What is the probability that an individual bottle contains less than 2.48 liters?
0.212 (Round to three decimal places as needed.)
b. If a sample of 4 bottles is selected, what is the probability that the sample mean amount contained is less
than 2.48 liters?
0.055 (Round to three decimal places as needed.)
c. If a sample of 25 bottles is selected, what is the probability that the sample mean amount contained is less
than 2.48 liters?
0.000 (Round to three decimal places as needed.)
d. Explain the difference in the results of (a) and (c).
Part (a) refers to an individual bottle, which can be thought of as a sample with sample size 2.48. Therefore,
the standard error of the mean for an individual bottle is 0 times the standard error of the sample in (c) with
sample size 25. This leads to a probability in part (a) that is larger than
the probability in part (c).
(Type integers or decimals. Do not round.)
e. Explain the difference in the results of (b) and (c).
The sample size in (c) is greater than the sample size in (b), so the standard error of the mean (or the standard
deviation of the sampling distribution) in (c) is greater than in (b). As the standard error decreases, values
become more concentrated around the mean. Therefore, the probability that the sample mean will fall close to
the population mean will always increase when the sample size increases.
Expert Solution
This question has been solved!
Explore an expertly crafted, step-by-step solution for a thorough understanding of key concepts.

This is a popular solution!

Trending now
This is a popular solution!

Step by step
Solved in 5 steps

Knowledge Booster


Learn more about
Need a deep-dive on the concept behind this application? Look no further. Learn more about this topic, statistics and related others by exploring similar questions and additional content below.Recommended textbooks for you
MATLAB: An Introduction with Applications
Statistics
ISBN:
9781119256830
Author:
Amos Gilat
Publisher:
John Wiley & Sons Inc

Probability and Statistics for Engineering and th…
Statistics
ISBN:
9781305251809
Author:
Jay L. Devore
Publisher:
Cengage Learning

Statistics for The Behavioral Sciences (MindTap C…
Statistics
ISBN:
9781305504912
Author:
Frederick J Gravetter, Larry B. Wallnau
Publisher:
Cengage Learning
MATLAB: An Introduction with Applications
Statistics
ISBN:
9781119256830
Author:
Amos Gilat
Publisher:
John Wiley & Sons Inc
Probability and Statistics for Engineering and th…
Statistics
ISBN:
9781305251809
Author:
Jay L. Devore
Publisher:
Cengage Learning
Statistics for The Behavioral Sciences (MindTap C…
Statistics
ISBN:
9781305504912
Author:
Frederick J Gravetter, Larry B. Wallnau
Publisher:
Cengage Learning

Elementary Statistics: Picturing the World (7th E…
Statistics
ISBN:
9780134683416
Author:
Ron Larson, Betsy Farber
Publisher:
PEARSON

The Basic Practice of Statistics
Statistics
ISBN:
9781319042578
Author:
David S. Moore, William I. Notz, Michael A. Fligner
Publisher:
W. H. Freeman

Introduction to the Practice of Statistics
Statistics
ISBN:
9781319013387
Author:
David S. Moore, George P. McCabe, Bruce A. Craig
Publisher:
W. H. Freeman