The annual revenue of Amazon.com rose from approximately $10.7 billion in 2006 to $34.2 billion in 2010.t (a) Use this information to find both a linear model and an exponential model for Amazon.com's annual revenue I (in billions of dollars) as a function of time t in years since 2000. (Round all coefficients to three significant digi linear model I(t) = exponential model I(t) = Which of these models would you judge to be more appropriate to the data shown below? t (Year since 2000) 6 8 9 10 I ($ billions) 10.7 14.8 19.2 24.5 34.2 The exponential model is more appropriate.
The annual revenue of Amazon.com rose from approximately $10.7 billion in 2006 to $34.2 billion in 2010.t (a) Use this information to find both a linear model and an exponential model for Amazon.com's annual revenue I (in billions of dollars) as a function of time t in years since 2000. (Round all coefficients to three significant digi linear model I(t) = exponential model I(t) = Which of these models would you judge to be more appropriate to the data shown below? t (Year since 2000) 6 8 9 10 I ($ billions) 10.7 14.8 19.2 24.5 34.2 The exponential model is more appropriate.

Chapter6: Exponential And Logarithmic Functions
Section6.8: Fitting Exponential Models To Data
Problem 2TI: Sales of a video game released in the year 2000 took off at first, but then steadily slowed as time...

Related questions

Question
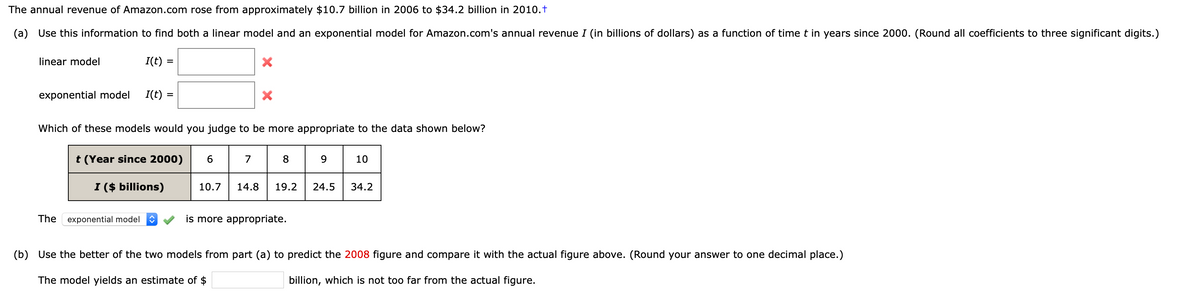
Transcribed Image Text:The annual revenue of Amazon.com rose from approximately $10.7 billion in 2006 to $34.2 billion in 2010.t
(a) Use this information to find both a linear model and an exponential model for Amazon.com's annual revenue I (in billions of dollars) as a function of time t in years since 2000. (Round all coefficients to three significant digits.)
linear model
I(t) =
exponential model
I(t)
Which of these models would you judge to be more appropriate to the data shown below?
t (Year since 2000) 6
.
7
8
10
I ($ billions)
10.7
14.8
19.2
24.5
34.2
The exponential model
is more appropriate.
(b) Use the better of the two models from part (a) to predict the 2008 figure and compare it with the actual figure above. (Round your answer to one decimal place.)
The model yields an estimate of $
billion, which is not too far from the actual figure.
Expert Solution
This question has been solved!
Explore an expertly crafted, step-by-step solution for a thorough understanding of key concepts.

This is a popular solution!

Trending now
This is a popular solution!

Step by step
Solved in 3 steps with 2 images

Knowledge Booster


Learn more about
Need a deep-dive on the concept behind this application? Look no further. Learn more about this topic, statistics and related others by exploring similar questions and additional content below.Recommended textbooks for you


College Algebra (MindTap Course List)
Algebra
ISBN:
9781305652231
Author:
R. David Gustafson, Jeff Hughes
Publisher:
Cengage Learning
College Algebra (MindTap Course List)
Algebra
ISBN:
9781305652231
Author:
R. David Gustafson, Jeff Hughes
Publisher:
Cengage Learning

Algebra & Trigonometry with Analytic Geometry
Algebra
ISBN:
9781133382119
Author:
Swokowski
Publisher:
Cengage

Glencoe Algebra 1, Student Edition, 9780079039897…
Algebra
ISBN:
9780079039897
Author:
Carter
Publisher:
McGraw Hill