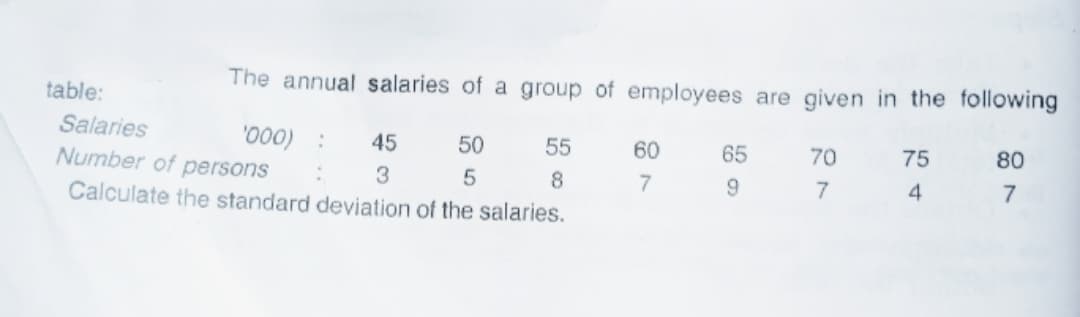
The annual salaries of a group of employees are given in the following table: Salaries '000) : 45 50 55 60 65 70 80 75 Number of persons 8 4 Calculate the standard deviation of the salaries.
Q: Calculate the standard deviation from the data given below : Size of item Frequency Size of item…
A:
Q: If the average age of retirement for the entire population in a country is 60 years and the…
A: Empirical rule: The probability of the observation lies within 1 standard deviation of the mean,…
Q: Assume that the amounts of weight that male college students gain during their freshman year are…
A: Given : Let X : Amount of weight that male college students gain during their freshman X~N(μ=1.4 ,…
Q: For each data set, compute the standard deviation. What is the standard deviation of the sample of…
A:
Q: Calculate the standard deviation of the data. 7 11 8 12 4 6 2 15 7 8
A: Standard deviation:The standard deviation indicates by how much each observation differs from a…
Q: Find the standard deviation of the given data rounded to the nearest hundredth. 3, 4, 5, 7, 10, 12,…
A: Given data is3,4,5,7,10,12,15sample size(n)=7
Q: The following data are the distances from the workplace (in miles) for the 5 employees of a small…
A: The distances from the workplace (in miles) for the 5 employees of a small business are given as:…
Q: The classification of 58 passengers of a bus in their age group is given below. You are required to…
A:
Q: Calculate the standard deviation from the data given below : Size of item Frequency Size of item…
A:
Q: Suppose the people living in a city have a mean score of 40 and a standard deviation of 7 on a…
A: As per guidelines, we will only solve first three subparts, please repost other questions for more…
Q: The weights of items from a manufacturing process follow a normal distribution with mean 90 grams…
A:
Q: find the V av iance and St andard deviation
A: We have Given a pdf of X whereas X is a continuous random Variable. The expected value or mean is…
Q: Calculate standard deviation from the following data. Marks Frequency | 6 0-10 10-20 20-30 30-40…
A: Class Interval Frequency, f Midpoint, x fx x2 fx2 0-10 6 5 30 25 150 10-20 8 15 120 225 1800…
Q: Calculate the standard deviation of the data shown, to two decimal places 16.1 18.5 19.3 14.4 3.9…
A:
Q: Find the range and standard deviation of the set of data. 11, 10, 5, 12, 12 O
A: The detailed solution is as follows below:
Q: On this assignment, round all answers (when necessary) to exactly three decimal places. The numbers…
A:
Q: Calculate the standard deviation from the data given below : Size of item Frequency Frequency Size…
A:
Q: 9. The mean July daily rainfall in Waterville is 10 mm and the standard deviation is 1.5 mm. Assume…
A: Consider a random variable X which represent that amount of daily rainfall in Waterville in the…
Q: The following data are the percentages of alcohol in five randomly selected brands of beer. Find the…
A: Given: Sample size n = 5 Formula Used: Population standard deviation σ = ∑i=1n(Xi-X)2n Where X is a…
Q: I have no clue..
A: Given data and calculation for the mean and standard deviation is shown below
Q: Suppose the people living in a city have a mean score of 40 and a standard deviation of 7 n a…
A: We have given that Mean=mu=40 Standard deviation=sigma=7
Q: In a mango farm of 250 trees, the mean harvest is 96.5 kilos of fruit per tree with a standard…
A: Given,sample size(n)=250mean(μ)=96.5standard deviation(σ)=8.4
Q: Here are the number of hours that each of a group of students studied for this exam: 2 4 22 2 1 4 1…
A: Solution Number of samples (n) = 10 Let "X" be the number of hours that each of a group of students…
Q: The annual salaries of a group of employees are given in the following tables: Salaries (in $ '000)…
A: x Frequency (f) f⋅x f⋅x2 45 3 135 6075 50 5 250 12500 55 8 440 24200 60 7 420 25200 65 9…
Q: Find the mean absolute deviation for the data in the table. Round to the nearest tenth if necessary.…
A:
Q: Find a 95% CI on the population standard deviation of speeds of drivers ticketed in a 55 mph zone…
A: Confidence interval population standard deviation : A confidence interval is an statistical…
Q: The following data pertaining to factory A and B are given. What is the combined monthly wage and…
A:
Q: Q 1-From the following data, calculate Standard Deviation marks 15 25 35 45 55 No. of student 10 20…
A: Given data is Marks No. of students 5 10 15 20 25 30 35 50 45 40 55 30
Q: Find the standard deviation, s, of sample data summarized in the frequency distribution table below…
A: Given: Interval Frequency 30-39 1 40-49 3 50-59 8 60-69 3 70-79 15 80-89 31 90-99…
Q: Find the range and standard deviation of the set of data. 12, 10, 5, 13, 15 O
A:
Q: A homeowner has 5 zucchini plants in her garden. Over the course of the season, the yields (number…
A:
Q: The following are that scores of 20 students who took a calculus exam. Find the mean and standard…
A:
Q: Assume Springfield house prices are Normally distributed with a mean of $415,000 and standard…
A:
Q: The Following are the scores of 20 students who took a calculus exam. Find the mean and standard…
A:
Q: Suppose the people living in a city have a mean score of 35 and a standard deviation of 9 on a…
A: A normal distribution has a bell shaped which is centred at mean. The standard normal distribution…
Q: A series of sodium chloride samples are analyzed and the following results were recorded: Sample…
A: In Statistics, deviation is a measure of difference between the observed value of a variable and…
Q: Assume that the monthly food expenditures of families of a certain size in one economic group are…
A: We have to find out given probabiity..
Q: Assume blood glucose levels are normally distributed with a mean of 80 mg/dL and a standard…
A: Obtain the proportion of people fall into the high range that is between 120-180 mg/dL. The…
Q: Find the standard deviation (rounded to the nearest unit) for the data indicated. Test Score…
A: Given Information:
Q: To determine the organic material in a dried lake bed, the percent carbon by mass is measured at two…
A: F test is used to check whether the variances or standard deviations of two groups differ (or) not.…
Q: The following data give the speeds (in kilometer) as measured by radar of 5 selected cars traveled…
A: The data shows the speeds (in kilometer) as measured by radar of 5 selected cars traveled at NLEX.
Q: Assume that the Leaf Area Index over a management area is normally distributed with a mean of 3 and…
A: Sample mean = M = 3 Standard details = s = 0.2
Q: The ratio of weight of the students is as follows in table - 1. Find the standard deviation of the…
A: Standard deviation of ungrouped data is σ=1n∑n=1nxi-x2.
Q: Calculate the standard deviation of the data shown, to two decimal places 3.5 21.1 7.7 16.5 22.8…
A:
Q: The following table gives the number of finished articles turned out per day by different number of…
A: Solution is given:
Q: Find the standard deviation for the group of data items. 5,5,5,5,7,9 (Simplify your answer.…
A: Solution:Computation of standard deviation:Standard deviation for the group of data items is…
Q: The following data represent the number of people aged 25 to 64 years covered by health insurance…
A: Given data : Sr no classes Frequency 1 25-34 20.6 2 35-44 36.7 3 45-54 33.2 4…
Q: A survey of 1000 men ages 20 to 30 found that their heights were normally distributed, with a mean…
A: From the provided information, Mean (µ) = 65 inches Standard deviation (σ) = 2.5 inches
Q: The selling price of a new car is normally distributed with an average of $19110 and a standard…
A: Let X denotes a selling price of a new car. Here, X follows normal distribution with mean value of…
Q: The weight of items produced by a machine is normally distributed with a mean of 8 ounces and a…
A: Given: μ=8, σ=2 The corresponding z-values needed to be computed are: The probability that the item…
Step by step
Solved in 2 steps with 1 images