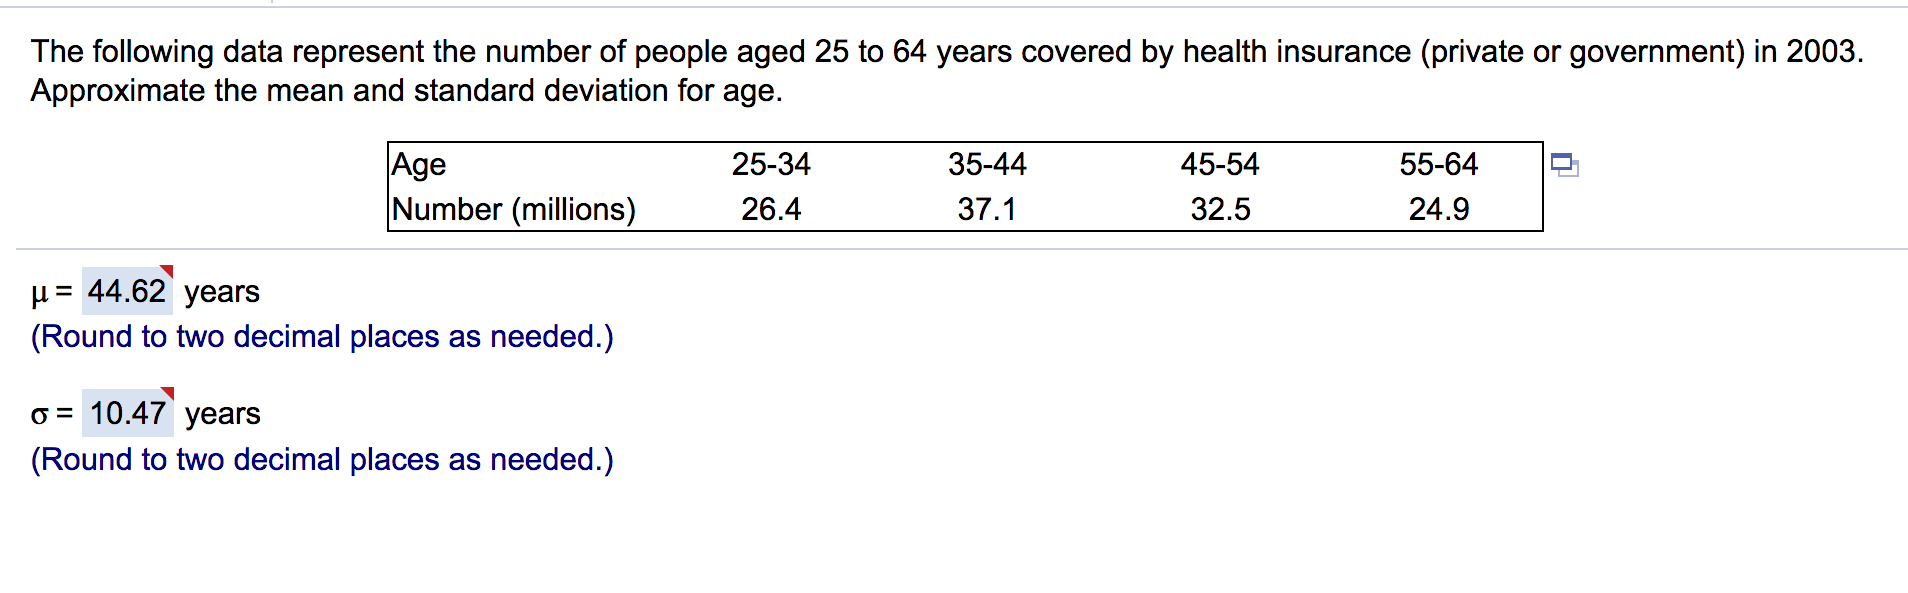
The following data represent the number of people aged 25 to 64 years covered by health insurance (private or government) in 2003 Approximate the mean and standard deviation for age. Age Number (millions) 25-34 35-44 45-54 55-64 24.9 26.4 37.1 32.5 = r1 44.62 years (Round to two decimal places as needed.) =10.47 years (Round to two decimal places as needed.)


Unitary Method
The word “unitary” comes from the word “unit”, which means a single and complete entity. In this method, we find the value of a unit product from the given number of products, and then we solve for the other number of products.
Speed, Time, and Distance
Imagine you and 3 of your friends are planning to go to the playground at 6 in the evening. Your house is one mile away from the playground and one of your friends named Jim must start at 5 pm to reach the playground by walk. The other two friends are 3 miles away.
Profit and Loss
The amount earned or lost on the sale of one or more items is referred to as the profit or loss on that item.
Units and Measurements
Measurements and comparisons are the foundation of science and engineering. We, therefore, need rules that tell us how things are measured and compared. For these measurements and comparisons, we perform certain experiments, and we will need the experiments to set up the devices.
I have no clue..


Trending now
This is a popular solution!

Step by step
Solved in 2 steps with 1 images


