The arm span and foot length were both measured (in centimeters) for each of 20 students in a biology class. The computer output displays the regression analysis. Predictor Coef SE Coef t-ratio 2.567 0.035 2.965 5.377 Constant -7.611 0.046 Arm span 0.186 0.000 s = 1.61 R-Sq = 63.08 R-Sq (Adj) = 64.9% Which of the following is the best interpretation of the coefficient of determination r2? About 37% of the variation in arm span is accounted for by the linear relationship formed with the foot length. About 65% of the variation in foot length is accounted for by the linear relationship formed with the arm span. O About 63% of the variation in arm span is accounted for by the linear relationship formed with the foot length. O About 63% of the variation in foot length is accounted for by the linear relationship formed with the arm span.
The arm span and foot length were both measured (in centimeters) for each of 20 students in a biology class. The computer output displays the regression analysis. Predictor Coef SE Coef t-ratio 2.567 0.035 2.965 5.377 Constant -7.611 0.046 Arm span 0.186 0.000 s = 1.61 R-Sq = 63.08 R-Sq (Adj) = 64.9% Which of the following is the best interpretation of the coefficient of determination r2? About 37% of the variation in arm span is accounted for by the linear relationship formed with the foot length. About 65% of the variation in foot length is accounted for by the linear relationship formed with the arm span. O About 63% of the variation in arm span is accounted for by the linear relationship formed with the foot length. O About 63% of the variation in foot length is accounted for by the linear relationship formed with the arm span.

Glencoe Algebra 1, Student Edition, 9780079039897, 0079039898, 2018
18th Edition
ISBN:9780079039897
Author:Carter
Publisher:Carter
Chapter4: Equations Of Linear Functions
Section4.6: Regression And Median-fit Lines
Problem 4GP

Related questions
Question
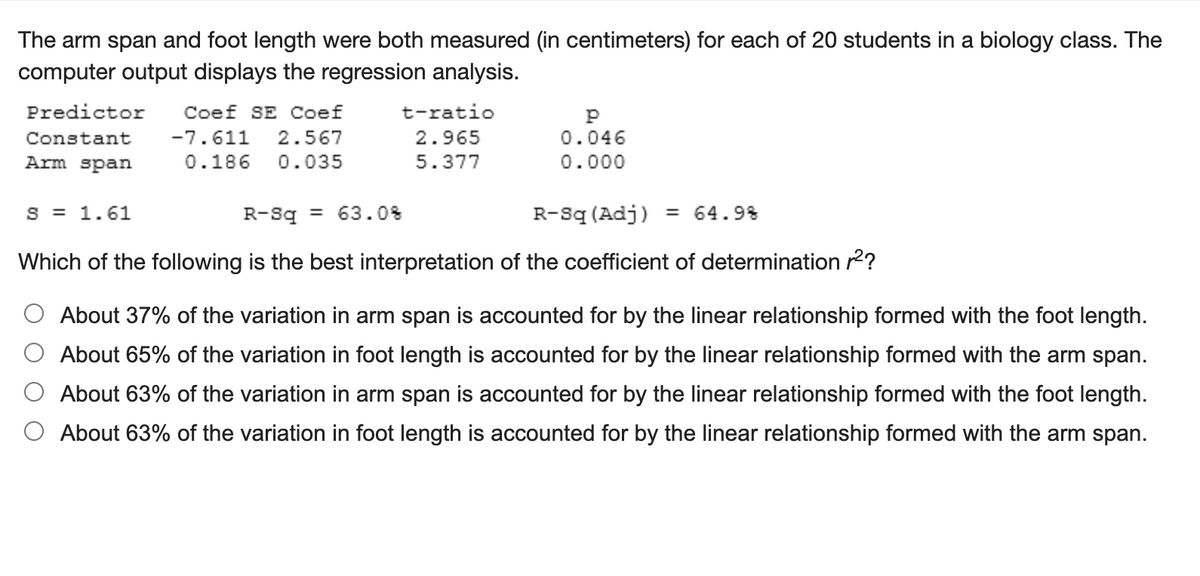
Transcribed Image Text:The arm span and foot length were both measured (in centimeters) for each of 20 students in a biology class. The
computer output displays the regression analysis.
Predictor
Coef SE Coef
t-ratio
Constant
-7.611
2.567
2.965
0.046
Arm span
0.186
0.035
5.377
0.000
S = 1.61
R-Sq = 63.0%
R-sq (Adj)
= 64.9%
%3D
Which of the following is the best interpretation of the coefficient of determination r2?
O About 37% of the variation in arm span is accounted for by the linear relationship formed with the foot length.
About 65% of the variation in foot length is accounted for by the linear relationship formed with the arm span.
About 63% of the variation in arm span is accounted for by the linear relationship formed with the foot length.
O About 63% of the variation in foot length is accounted for by the linear relationship formed with the arm span.
Expert Solution
This question has been solved!
Explore an expertly crafted, step-by-step solution for a thorough understanding of key concepts.

Step by step
Solved in 2 steps

Recommended textbooks for you
Glencoe Algebra 1, Student Edition, 9780079039897…
Algebra
ISBN:
9780079039897
Author:
Carter
Publisher:
McGraw Hill
Glencoe Algebra 1, Student Edition, 9780079039897…
Algebra
ISBN:
9780079039897
Author:
Carter
Publisher:
McGraw Hill