The article "Uncertainty and Climate Change" (G. Heal and B. Kriström, Environmental and Resource Economics, 2002:3–39) considers three scenarios, labeled A, B, and C, for the impact of global warming on income. For each scenario, a probability mass function for the loss of income is specified. These are presented in the following table. Probability Loss (%) Scenario A Scenario B Scenario C 0.65 0.65 0.65 0.24 0.2 0.24 0.1 10 0.01 15 0.1 0.1 20 0.01 0.05 25 Compute the mean and standard deviation of the loss under scenario A. a. b. Compute the mean and standard deviation of the loss under scenario B. Compute the mean and standard deviation of the loss under scenario C. C. d. Under each scenario, compute the probability that the loss is less than 10%.
The article "Uncertainty and Climate Change" (G. Heal and B. Kriström, Environmental and Resource Economics, 2002:3–39) considers three scenarios, labeled A, B, and C, for the impact of global warming on income. For each scenario, a probability mass function for the loss of income is specified. These are presented in the following table. Probability Loss (%) Scenario A Scenario B Scenario C 0.65 0.65 0.65 0.24 0.2 0.24 0.1 10 0.01 15 0.1 0.1 20 0.01 0.05 25 Compute the mean and standard deviation of the loss under scenario A. a. b. Compute the mean and standard deviation of the loss under scenario B. Compute the mean and standard deviation of the loss under scenario C. C. d. Under each scenario, compute the probability that the loss is less than 10%.

Holt Mcdougal Larson Pre-algebra: Student Edition 2012
1st Edition
ISBN:9780547587776
Author:HOLT MCDOUGAL
Publisher:HOLT MCDOUGAL
Chapter11: Data Analysis And Probability
Section: Chapter Questions
Problem 8CR

Related questions
Question
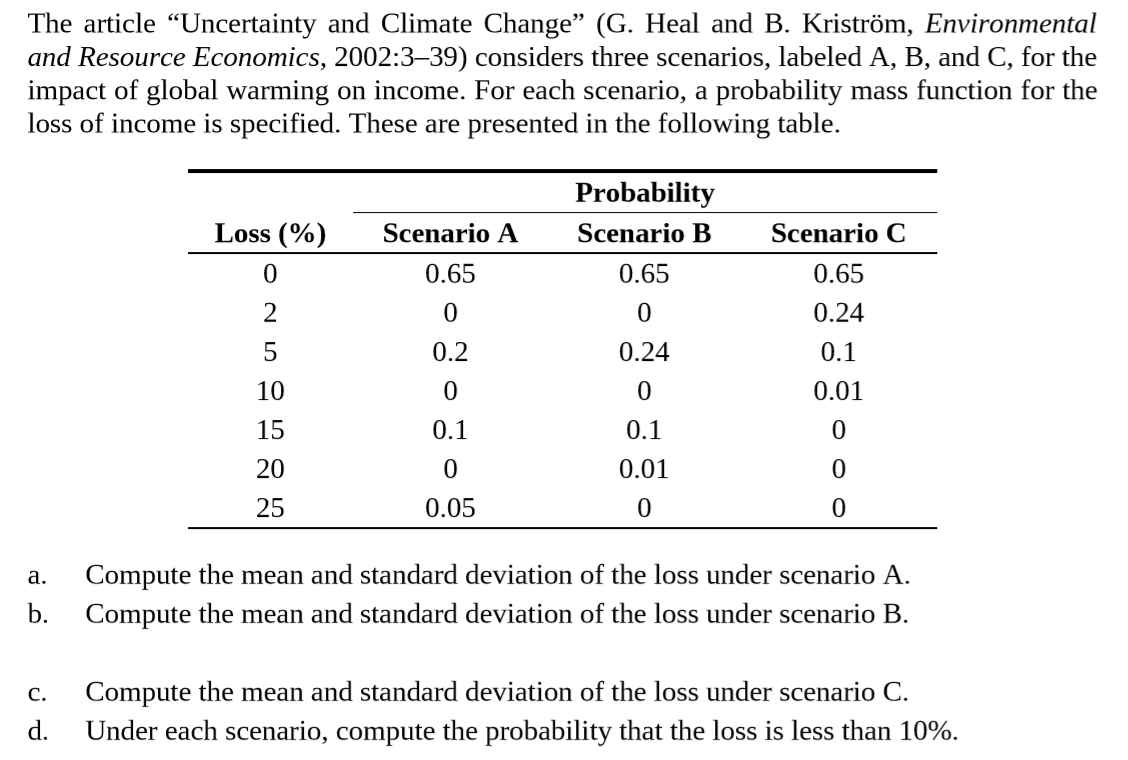
Transcribed Image Text:The article "Uncertainty and Climate Change" (G. Heal and B. Kriström, Environmental
and Resource Economics, 2002:3–39) considers three scenarios, labeled A, B, and C, for the
impact of global warming on income. For each scenario, a probability mass function for the
loss of income is specified. These are presented in the following table.
Probability
Loss (%)
Scenario A
Scenario B
Scenario C
0.65
0.65
0.65
0.24
0.2
0.24
0.1
10
0.01
15
0.1
0.1
20
0.01
0.05
25
Compute the mean and standard deviation of the loss under scenario A.
a.
b.
Compute the mean and standard deviation of the loss under scenario B.
Compute the mean and standard deviation of the loss under scenario C.
C.
d.
Under each scenario, compute the probability that the loss is less than 10%.
Expert Solution
This question has been solved!
Explore an expertly crafted, step-by-step solution for a thorough understanding of key concepts.

This is a popular solution!

Trending now
This is a popular solution!

Step by step
Solved in 3 steps with 10 images

Recommended textbooks for you
Holt Mcdougal Larson Pre-algebra: Student Edition…
Algebra
ISBN:
9780547587776
Author:
HOLT MCDOUGAL
Publisher:
HOLT MCDOUGAL

Holt Mcdougal Larson Pre-algebra: Student Edition…
Algebra
ISBN:
9780547587776
Author:
HOLT MCDOUGAL
Publisher:
HOLT MCDOUGAL