The average final exam score for the statistics course is 43%. A professor wants to see if the average final exam score for students who are given colored pens on the first day of class is larger. The final exam scores for the 19 randomly selected students who were given the colored pens are shown below. Assume that the distribution of the population is normal. 54, 38, 45, 47, 42, 42, 48, 38, 56, 51, 46, 41, 43, 41, 37, 40, 53, 43, 43 Copy to clipboard What can be concluded at the = 0.05 level of the significance? a. For this study, we should use Select an enswer b. The ll and alternative hypothese would be: Ho: ? Select an answer H1: ?v Select an answer c. The test statistic ? v places.) The p-value - The p-value is ? va f. Based on this, we should Select an answer ♥ the null hypothesis. g. Thus, the coenelusien is that.. Select an anewer (please show your answer to 3 decimal (Please show your answer to 4 decimal places.)
The average final exam score for the statistics course is 43%. A professor wants to see if the average final exam score for students who are given colored pens on the first day of class is larger. The final exam scores for the 19 randomly selected students who were given the colored pens are shown below. Assume that the distribution of the population is normal. 54, 38, 45, 47, 42, 42, 48, 38, 56, 51, 46, 41, 43, 41, 37, 40, 53, 43, 43 Copy to clipboard What can be concluded at the = 0.05 level of the significance? a. For this study, we should use Select an enswer b. The ll and alternative hypothese would be: Ho: ? Select an answer H1: ?v Select an answer c. The test statistic ? v places.) The p-value - The p-value is ? va f. Based on this, we should Select an answer ♥ the null hypothesis. g. Thus, the coenelusien is that.. Select an anewer (please show your answer to 3 decimal (Please show your answer to 4 decimal places.)

Glencoe Algebra 1, Student Edition, 9780079039897, 0079039898, 2018
18th Edition
ISBN:9780079039897
Author:Carter
Publisher:Carter
Chapter10: Statistics
Section10.4: Distributions Of Data
Problem 19PFA

Related questions
Question
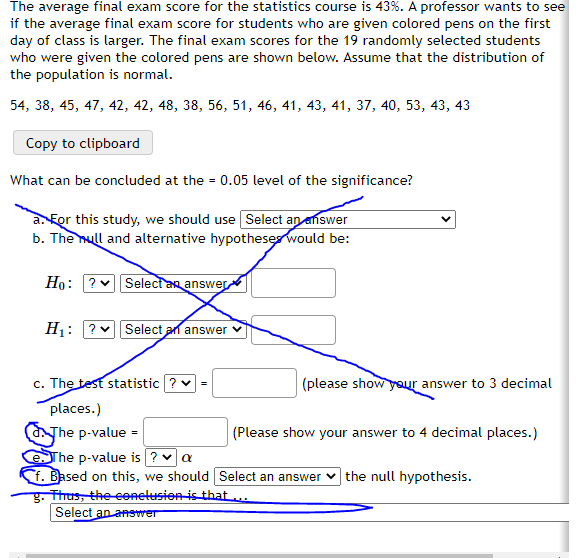
Transcribed Image Text:The average final exam score for the statistics course is 43%. A professor wants to see
if the average final exam score for students who are given colored pens on the first
day of class is larger. The final exam scores for the 19 randomly selected students
who were given the colored pens are shown below. Assume that the distribution of
the population is normal.
54, 38, 45, 47, 42, 42, 48, 38, 56, 51, 46, 41, 43, 41, 37, 40, 53, 43, 43
Copy to clipboard
What can be concluded at the = 0.05 level of the significance?
a. For this study, we should use Select an enswer
b. The null and alternative hypothese would be:
Но:
V Select an answer
H1: ?
Select an answer v
c. The test statistic ? v =
(please show your answer to 3 decimal
places.)
aThe p-value =
SThe p-value is ? va
f. Based on this, we should Select an answer
g. Thus, the eenelusion is that ...
Select an anewer
(Please show your answer to 4 decimal places.)
the null hypothesis.
Expert Solution
This question has been solved!
Explore an expertly crafted, step-by-step solution for a thorough understanding of key concepts.

Step by step
Solved in 6 steps

Recommended textbooks for you
Glencoe Algebra 1, Student Edition, 9780079039897…
Algebra
ISBN:
9780079039897
Author:
Carter
Publisher:
McGraw Hill

Big Ideas Math A Bridge To Success Algebra 1: Stu…
Algebra
ISBN:
9781680331141
Author:
HOUGHTON MIFFLIN HARCOURT
Publisher:
Houghton Mifflin Harcourt
Glencoe Algebra 1, Student Edition, 9780079039897…
Algebra
ISBN:
9780079039897
Author:
Carter
Publisher:
McGraw Hill
Big Ideas Math A Bridge To Success Algebra 1: Stu…
Algebra
ISBN:
9781680331141
Author:
HOUGHTON MIFFLIN HARCOURT
Publisher:
Houghton Mifflin Harcourt