The average number of accidents at controlled intersections per year is 5.3. Is this average a different number for intersections with cameras installed? The 69 randomly observed Intersections with cameras installed had an average of 4.9 accidents per year and the standard devlation was 1.18. What can be concluded at the a = 0.05 level of signtficance? a. For this study, we should use Select an answer b. The null and alternative hypotheses would be: Ho: ?vSelect an answerv H: ?vSelect an answerv c. The test statistic ?v = (please show your answer to 3 decimal places.) d. The p-value (Please show your answer to 4 decimal places.) %3D e. The p-value is ?v a f. Based on this, we should Select an answerv the null hypothesis. g. Thus, the final conclusion is that ... O The data suggest that the sample mean is not significantly different from 5.3 at a = 0.05, so there is statistically insignificant evidence to conclude that the sample mean number of accidents per year at intersections with cameras installed is different from 4.9 accidents. %3D O The data suggest that the populaton mean is significantly different from 5.3 at a = 0.05, so there is statistically significant evidence to conclude that the population mean number of accidents per year at intersections with cameras installed is different from 5.3 accidents. %3! O The data suggest that the population mean is not significantly different from 5.3 at a = 0.05, so there is statistically insignificant evidence to conclude that the population mean number of accidents per year at intersections with cameras installed is different from 5.3 accidents. h. Interpret the p-value in the context of the study. O If the population mean number of accidents per year at intersections with cameras installed is 5.3 and if another 69 intersections with cameras installed are observed then there would be a 0.63608122% chance that the sample mean for these 69 intersections with cameras installed would either be less than 4.9 or greater than 5.7. O There is a 0.63608122% chance that the population mean number of accidents per year at intersections with cameras installed is not equal to 5.3.
The average number of accidents at controlled intersections per year is 5.3. Is this average a different number for intersections with cameras installed? The 69 randomly observed Intersections with cameras installed had an average of 4.9 accidents per year and the standard devlation was 1.18. What can be concluded at the a = 0.05 level of signtficance? a. For this study, we should use Select an answer b. The null and alternative hypotheses would be: Ho: ?vSelect an answerv H: ?vSelect an answerv c. The test statistic ?v = (please show your answer to 3 decimal places.) d. The p-value (Please show your answer to 4 decimal places.) %3D e. The p-value is ?v a f. Based on this, we should Select an answerv the null hypothesis. g. Thus, the final conclusion is that ... O The data suggest that the sample mean is not significantly different from 5.3 at a = 0.05, so there is statistically insignificant evidence to conclude that the sample mean number of accidents per year at intersections with cameras installed is different from 4.9 accidents. %3D O The data suggest that the populaton mean is significantly different from 5.3 at a = 0.05, so there is statistically significant evidence to conclude that the population mean number of accidents per year at intersections with cameras installed is different from 5.3 accidents. %3! O The data suggest that the population mean is not significantly different from 5.3 at a = 0.05, so there is statistically insignificant evidence to conclude that the population mean number of accidents per year at intersections with cameras installed is different from 5.3 accidents. h. Interpret the p-value in the context of the study. O If the population mean number of accidents per year at intersections with cameras installed is 5.3 and if another 69 intersections with cameras installed are observed then there would be a 0.63608122% chance that the sample mean for these 69 intersections with cameras installed would either be less than 4.9 or greater than 5.7. O There is a 0.63608122% chance that the population mean number of accidents per year at intersections with cameras installed is not equal to 5.3.

Glencoe Algebra 1, Student Edition, 9780079039897, 0079039898, 2018
18th Edition
ISBN:9780079039897
Author:Carter
Publisher:Carter
Chapter10: Statistics
Section10.3: Measures Of Spread
Problem 1GP

Related questions

Concept explainers
Contingency Table
A contingency table can be defined as the visual representation of the relationship between two or more categorical variables that can be evaluated and registered. It is a categorical version of the scatterplot, which is used to investigate the linear relationship between two variables. A contingency table is indeed a type of frequency distribution table that displays two variables at the same time.
Binomial Distribution
Binomial is an algebraic expression of the sum or the difference of two terms. Before knowing about binomial distribution, we must know about the binomial theorem.
Topic Video
Question
repost
![om/courses/26466/assignments/478868
The data suggest that the population mean is not significantly different from 5.3 at a = 0.05,
so there is statistically insignificant evidence to conclude that the population mean number of
accidents per year at intersections with cameras installed is different from 5.3 accidents.
h. Interpret the p-value in the context of the study.
O f the population mean number of accidents per year at intersections with cameras installed is
5.3 and if another 69 intersections with cameras installed are observed then there would be a
0.63608122% chance that the sample mean for these 69 intersections with cameras installed
would either be less than 4.9 or greater than 5.7.
O There is a 0.63608122% chance that the population mean number of accidents per year at
intersections with cameras installed is not equal to 5.3.
O There is a 0.63608122% chance of a Type I error.
O If the population mean number of accidents per year at intersections with cameras installed is
5.3 and if another 69 intersections with cameras installed are observed then there would be a
0.63608122% chance that the population mean would either be less than 4.9 or greater than
5.7.
i. Interpret the level of significance in the context of the study.
O There is a 5% chance that the population mean number of accidents per year at intersections
with cameras installed is different from 5.3.
O If the population mean number of accidents per year at intersections with cameras installed is
5.3 and if another 69 intersections with cameras installed are observed then there would be a
5% chance that we would end up falsely concluding that the population mean number of
accidents per year at intersections with cameras installed is different from 5.3.
O There is a 5% chance that you will get in a car accident, so please wear a seat belt.
O f the population population mean number of accidents per year at intersections with cameras
installed is different from 5.3 and if another 69 intersections with cameras installed are
observed then there would be a 5% chance that we would end up falsely concluding that the
population mean number of accidents per year at intersections with cameras installed is equal
to 5.3.
Hint:
Helpful Videos: Calculations [+] Setup [+] Interpretations [1
Help
Submit Question](/v2/_next/image?url=https%3A%2F%2Fcontent.bartleby.com%2Fqna-images%2Fquestion%2F4f1af382-e5ff-418b-a9e7-b713cc30d9f8%2F16272465-4272-46ee-87f9-bfb0a4b7c8a0%2Fqbbnols_processed.jpeg&w=3840&q=75)
Transcribed Image Text:om/courses/26466/assignments/478868
The data suggest that the population mean is not significantly different from 5.3 at a = 0.05,
so there is statistically insignificant evidence to conclude that the population mean number of
accidents per year at intersections with cameras installed is different from 5.3 accidents.
h. Interpret the p-value in the context of the study.
O f the population mean number of accidents per year at intersections with cameras installed is
5.3 and if another 69 intersections with cameras installed are observed then there would be a
0.63608122% chance that the sample mean for these 69 intersections with cameras installed
would either be less than 4.9 or greater than 5.7.
O There is a 0.63608122% chance that the population mean number of accidents per year at
intersections with cameras installed is not equal to 5.3.
O There is a 0.63608122% chance of a Type I error.
O If the population mean number of accidents per year at intersections with cameras installed is
5.3 and if another 69 intersections with cameras installed are observed then there would be a
0.63608122% chance that the population mean would either be less than 4.9 or greater than
5.7.
i. Interpret the level of significance in the context of the study.
O There is a 5% chance that the population mean number of accidents per year at intersections
with cameras installed is different from 5.3.
O If the population mean number of accidents per year at intersections with cameras installed is
5.3 and if another 69 intersections with cameras installed are observed then there would be a
5% chance that we would end up falsely concluding that the population mean number of
accidents per year at intersections with cameras installed is different from 5.3.
O There is a 5% chance that you will get in a car accident, so please wear a seat belt.
O f the population population mean number of accidents per year at intersections with cameras
installed is different from 5.3 and if another 69 intersections with cameras installed are
observed then there would be a 5% chance that we would end up falsely concluding that the
population mean number of accidents per year at intersections with cameras installed is equal
to 5.3.
Hint:
Helpful Videos: Calculations [+] Setup [+] Interpretations [1
Help
Submit Question
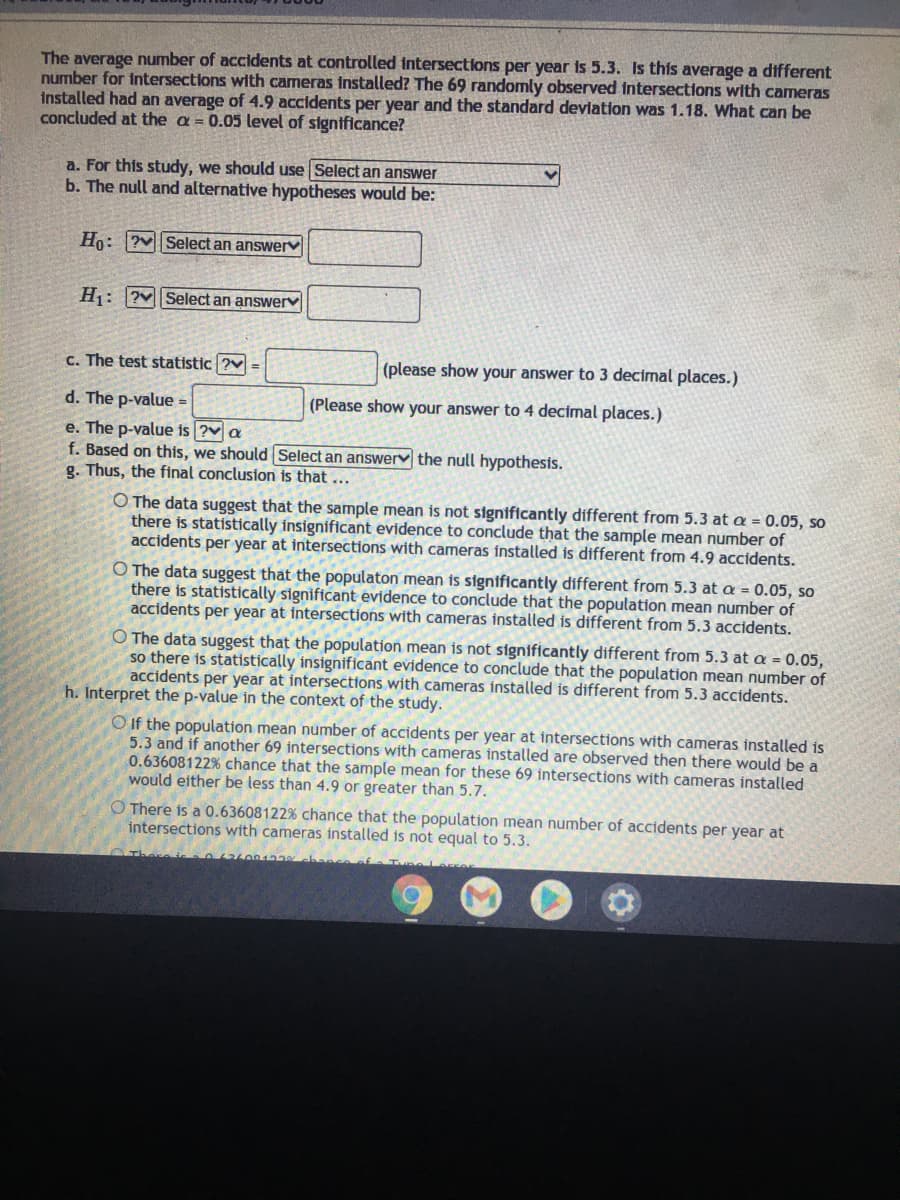
Transcribed Image Text:The average number of accidents at controlled intersections per year is 5.3. Is this average a different
number for intersections with cameras installed? The 69 randomly observed Intersections with cameras
installed had an average of 4.9 accidents per year and the standard devlation was 1.18. What can be
concluded at the a= 0.05 level of signtficance?
a. For this study, we should use Select an answer
b. The null and alternative hypotheses would be:
Ho: ?vSelect an answerv
H: ?v Select an answerv
c. The test statistic ?v
(please show your answer to 3 decimal places.)
d. The p-value =
(Please show your answer to 4 decimal places.)
e. The p-value is ?v a
f. Based on this, we should Select an answerv the null hypothesis.
g. Thus, the final conclusion is that ...
O The data suggest that the sample mean is not significantly different from 5.3 at a = 0.05, so
there is statistically insignificant evidence to conclude that the sample mean number of
accidents per year at intersections with cameras installed is different from 4.9 accidents.
O The data suggest that the populaton mean is significantly different from 5.3 at a = 0.05, so
there is statistically significant evidence to conclude that the population mean number of
accidents per year at intersections with cameras installed is different from 5.3 accidents.
O The data suggest that the population mean is not significantly different from 5.3 at a = 0.05,
so there is statistically insignificant evidence to conclude that the population mean number of
accidents per year at intersections with cameras installed is different from 5.3 accidents.
h. Interpret the p-value in the context of the study.
O If the population mean number of accidents per year at intersections with cameras installed is
5.3 and if another 69 intersections with cameras installed are observed then there would be a
0.63608122% chance that the sample mean for these 69 intersections with cameras installed
would either be less than 4.9 or greater than 5.7.
O There is a 0.63608122% chance that the population mean number of accidents per year at
intersections with cameras installed is not equal to 5.3.
Expert Solution
This question has been solved!
Explore an expertly crafted, step-by-step solution for a thorough understanding of key concepts.

This is a popular solution!

Trending now
This is a popular solution!

Step by step
Solved in 3 steps with 6 images

Knowledge Booster


Learn more about
Need a deep-dive on the concept behind this application? Look no further. Learn more about this topic, statistics and related others by exploring similar questions and additional content below.Recommended textbooks for you
Glencoe Algebra 1, Student Edition, 9780079039897…
Algebra
ISBN:
9780079039897
Author:
Carter
Publisher:
McGraw Hill
Glencoe Algebra 1, Student Edition, 9780079039897…
Algebra
ISBN:
9780079039897
Author:
Carter
Publisher:
McGraw Hill