Are Republicans more likely than Democrats to display the American flag in front of their residence on the Fourth of July? 396 of the 640 Republicans surveyed display the flag on the Fourth of July and 373 of the 665 Democrats surveyed display the flag on the Fourth of July. What can be concluded at the a = 0.05 level of significance? %3D For this study, we should use Select an answer a. The null and alternative hypotheses would be: Но: Select an answer Select an answer Select an answer v (please enter a decimal) H1: Select an answer Select an answer Select an answer (Please enter a decimal) b. The test statistic (? (please show your answer to 3 decimal places.) c. The p-value = (Please show your answer to 4 decimal places.) d. The p-value is (? e. Based on this, we should | Select an answer the null hypothesis. f. Thus, the final conclusion is that ...
Are Republicans more likely than Democrats to display the American flag in front of their residence on the Fourth of July? 396 of the 640 Republicans surveyed display the flag on the Fourth of July and 373 of the 665 Democrats surveyed display the flag on the Fourth of July. What can be concluded at the a = 0.05 level of significance? %3D For this study, we should use Select an answer a. The null and alternative hypotheses would be: Но: Select an answer Select an answer Select an answer v (please enter a decimal) H1: Select an answer Select an answer Select an answer (Please enter a decimal) b. The test statistic (? (please show your answer to 3 decimal places.) c. The p-value = (Please show your answer to 4 decimal places.) d. The p-value is (? e. Based on this, we should | Select an answer the null hypothesis. f. Thus, the final conclusion is that ...

Holt Mcdougal Larson Pre-algebra: Student Edition 2012
1st Edition
ISBN:9780547587776
Author:HOLT MCDOUGAL
Publisher:HOLT MCDOUGAL
Chapter11: Data Analysis And Probability
Section: Chapter Questions
Problem 8CR

Related questions

Question
Need help for all of it please please
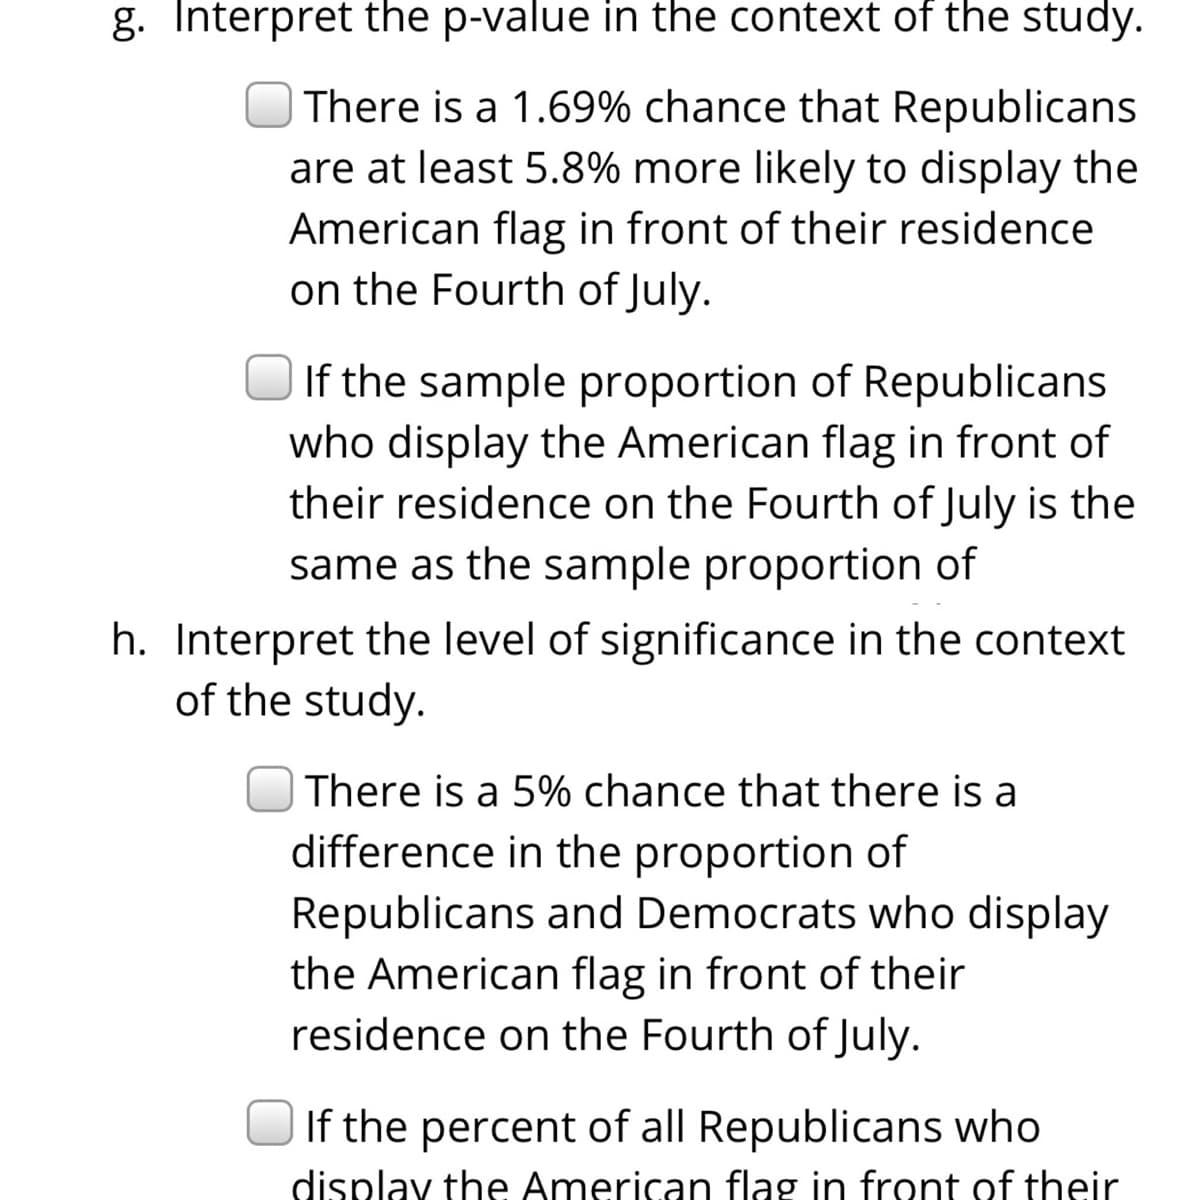
Transcribed Image Text:g. Interpret the p-value in the context of the study.
There is a 1.69% chance that Republicans
are at least 5.8% more likely to display the
American flag in front of their residence
on the Fourth of July.
If the sample proportion of Republicans
who display the American flag in front of
their residence on the Fourth of July is the
same as the sample proportion of
h. Interpret the level of significance in the context
of the study.
| There is a 5% chance that there is a
difference in the proportion of
Republicans and Democrats who display
the American flag in front of their
residence on the Fourth of July.
If the percent of all Republicans who
display the American flag in front of their
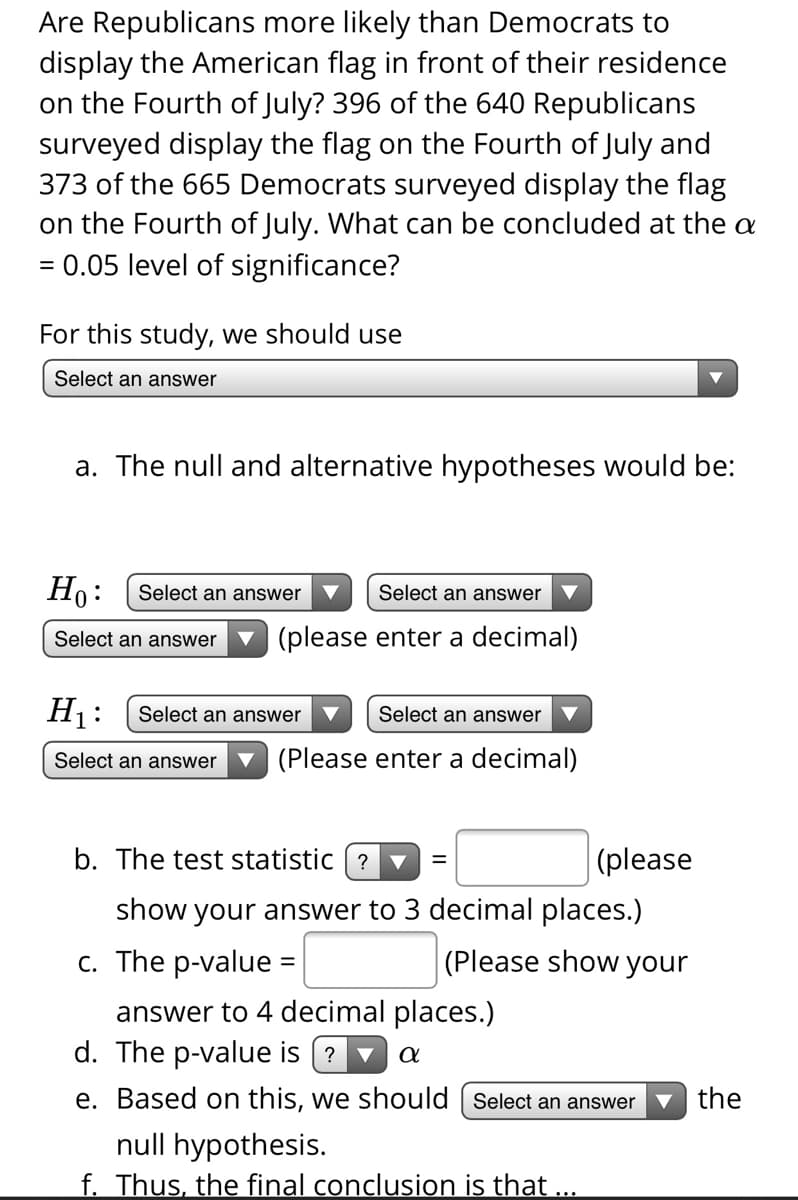
Transcribed Image Text:Are Republicans more likely than Democrats to
display the American flag in front of their residence
on the Fourth of July? 396 of the 640 Republicans
surveyed display the flag on the Fourth of July and
373 of the 665 Democrats surveyed display the flag
on the Fourth of July. What can be concluded at the a
= 0.05 level of significance?
For this study, we should use
Select an answer
a. The null and alternative hypotheses would be:
Но:
Select an answer
Select an answer
Select an answer
(please enter a decimal)
H1:
Select an answer
Select an answer
Select an answer
v (Please enter a decimal)
b. The test statistic (?
(please
show your answer to 3 decimal places.)
c. The p-value =
(Please show your
answer to 4 decimal places.)
d. The p-value is (?
e. Based on this, we should [ Select an answer
v the
null hypothesis.
f. Thus, the final conclusion is that ...
Expert Solution
This question has been solved!
Explore an expertly crafted, step-by-step solution for a thorough understanding of key concepts.

Step by step
Solved in 3 steps

Knowledge Booster


Learn more about
Need a deep-dive on the concept behind this application? Look no further. Learn more about this topic, statistics and related others by exploring similar questions and additional content below.Recommended textbooks for you
Holt Mcdougal Larson Pre-algebra: Student Edition…
Algebra
ISBN:
9780547587776
Author:
HOLT MCDOUGAL
Publisher:
HOLT MCDOUGAL

College Algebra
Algebra
ISBN:
9781305115545
Author:
James Stewart, Lothar Redlin, Saleem Watson
Publisher:
Cengage Learning
Holt Mcdougal Larson Pre-algebra: Student Edition…
Algebra
ISBN:
9780547587776
Author:
HOLT MCDOUGAL
Publisher:
HOLT MCDOUGAL
College Algebra
Algebra
ISBN:
9781305115545
Author:
James Stewart, Lothar Redlin, Saleem Watson
Publisher:
Cengage Learning