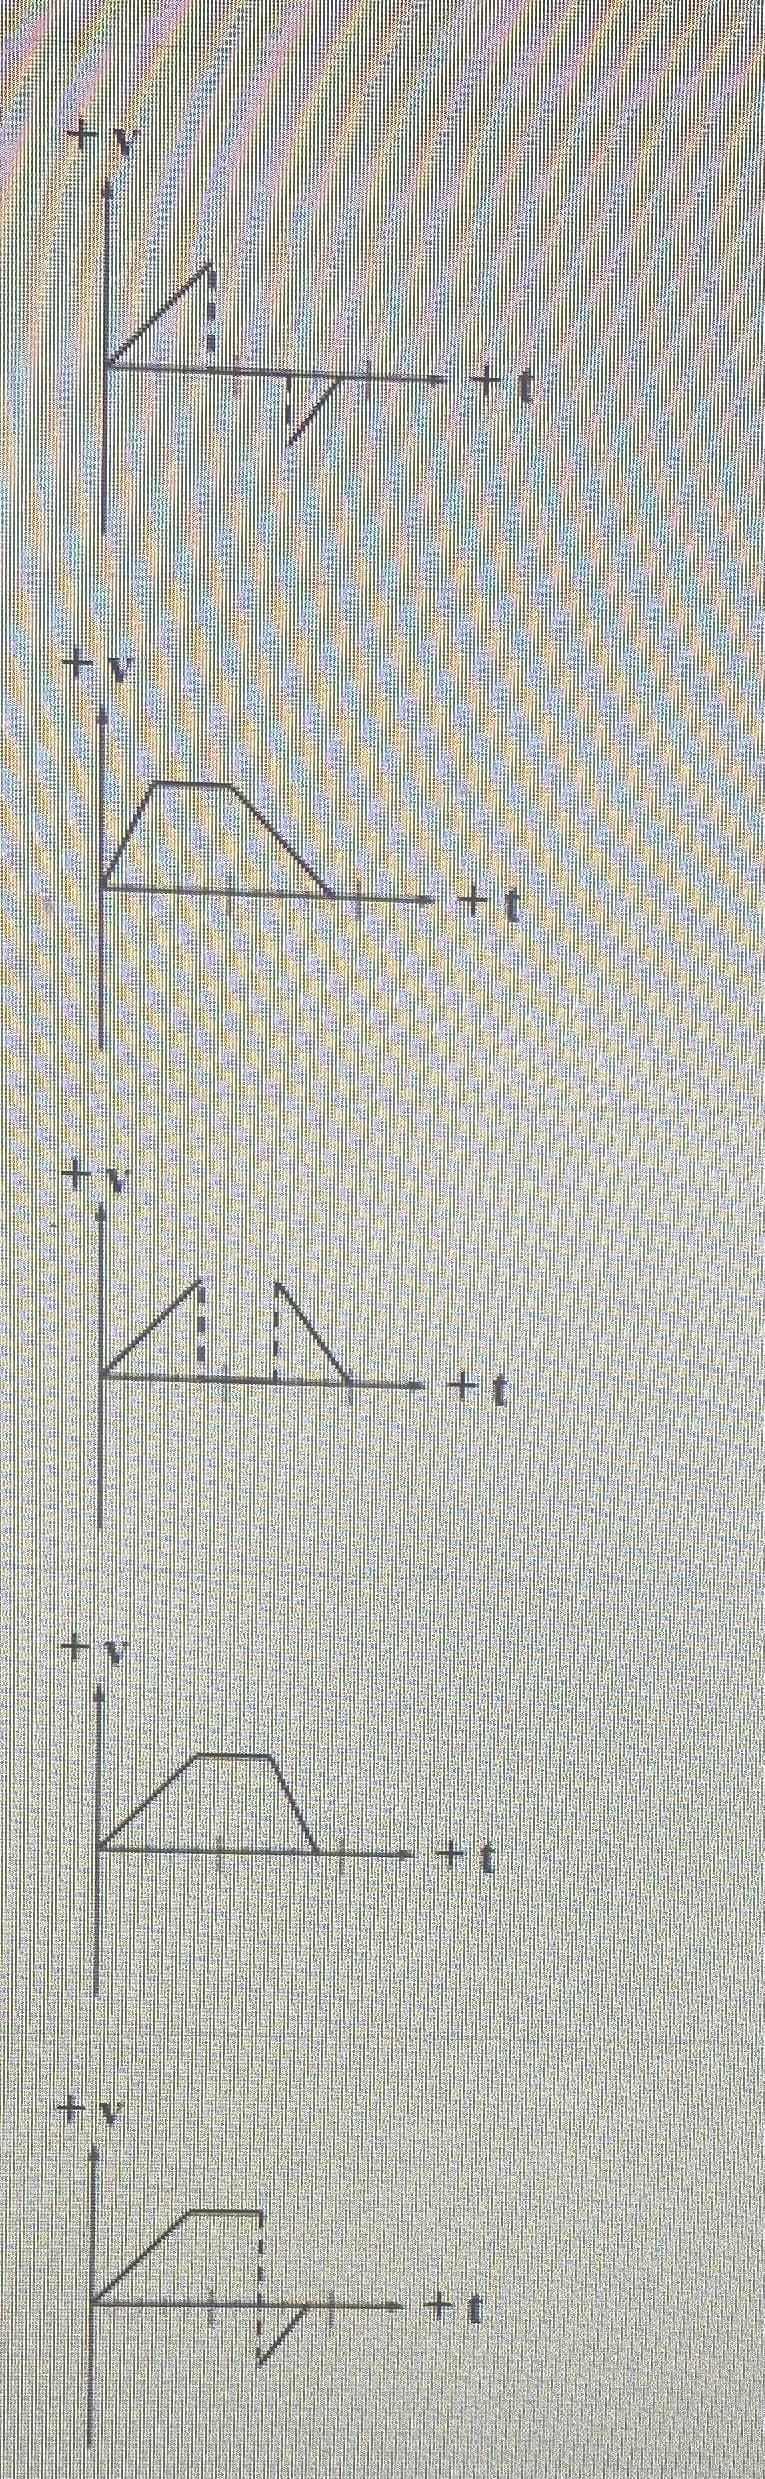
The black dot in the diagram below is moving along the positive x-axis. Its position has been plotted after every 10 seconds on a scale, as shown below. What graphs best represent the object’s velocity as a function of time?
The black dot in the diagram below is moving along the positive x-axis. Its position has been plotted after every 10 seconds on a scale, as shown below. What graphs best represent the object’s velocity as a function of time?

Glencoe Physics: Principles and Problems, Student Edition
1st Edition
ISBN:9780078807213
Author:Paul W. Zitzewitz
Publisher:Paul W. Zitzewitz
Chapter6: Motion In Two Dimensions
Section: Chapter Questions
Problem 54A

Related questions
Question
The black dot in the diagram below is moving along the positive x-axis. Its position has been plotted after every 10 seconds on a scale, as shown below. What graphs best represent the object’s velocity as a function of time?

Transcribed Image Text:+
+y
十t
h.
++
++
+t.
Expert Solution
This question has been solved!
Explore an expertly crafted, step-by-step solution for a thorough understanding of key concepts.

Step by step
Solved in 3 steps with 2 images

Knowledge Booster


Learn more about
Need a deep-dive on the concept behind this application? Look no further. Learn more about this topic, physics and related others by exploring similar questions and additional content below.Recommended textbooks for you
Glencoe Physics: Principles and Problems, Student…
Physics
ISBN:
9780078807213
Author:
Paul W. Zitzewitz
Publisher:
Glencoe/McGraw-Hill
Glencoe Physics: Principles and Problems, Student…
Physics
ISBN:
9780078807213
Author:
Paul W. Zitzewitz
Publisher:
Glencoe/McGraw-Hill