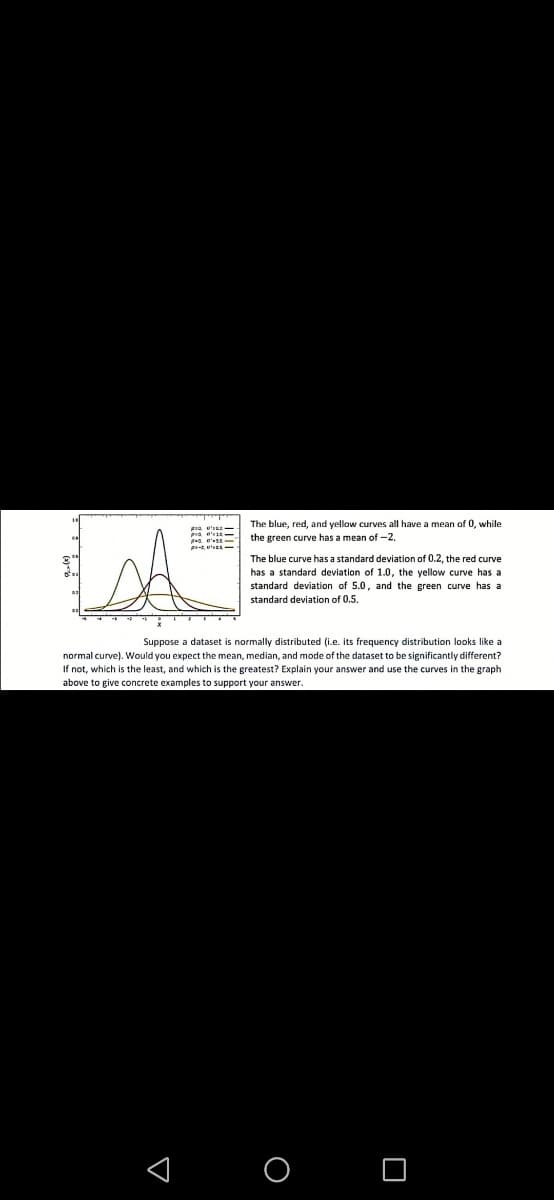
The blue, red, and yellow curves all have a mean of 0, while the green curve has a mean of -2. pra e' - a e'se- The blue curve has a standard deviation of 0.2, the red curve has a standard deviation of 1.0, the yellow curve has a standard deviation of 5.0, and the green curve has a standard deiation of 0.5
The blue, red, and yellow curves all have a mean of 0, while the green curve has a mean of -2. pra e' - a e'se- The blue curve has a standard deviation of 0.2, the red curve has a standard deviation of 1.0, the yellow curve has a standard deviation of 5.0, and the green curve has a standard deiation of 0.5

Glencoe Algebra 1, Student Edition, 9780079039897, 0079039898, 2018
18th Edition
ISBN:9780079039897
Author:Carter
Publisher:Carter
Chapter10: Statistics
Section10.3: Measures Of Spread
Problem 26PFA

Related questions
Question
Transcribed Image Text:The blue, red, and yellow curves all have a mean of 0, while
the green curve has a mean of -2.
The blue curve has a standard deviation of 0.2, the red curve
1.0, the yellow curve has a
standard deviation of 5.0, and the green curve has a
has a standard deviation
standard deviation of 0.5.
Suppose a dataset is normally distributed (i.e. its frequency distribution looks like a
normal curve). Would you expect the mean, median, and mode of the dataset to be significantly different?
If not, which is the least, and which is the greatest? Explain your answer and use the curves in the graph
above to give concrete examples to support your answer.
< O O
Expert Solution
This question has been solved!
Explore an expertly crafted, step-by-step solution for a thorough understanding of key concepts.

Step by step
Solved in 2 steps with 2 images

Recommended textbooks for you
Glencoe Algebra 1, Student Edition, 9780079039897…
Algebra
ISBN:
9780079039897
Author:
Carter
Publisher:
McGraw Hill
Glencoe Algebra 1, Student Edition, 9780079039897…
Algebra
ISBN:
9780079039897
Author:
Carter
Publisher:
McGraw Hill