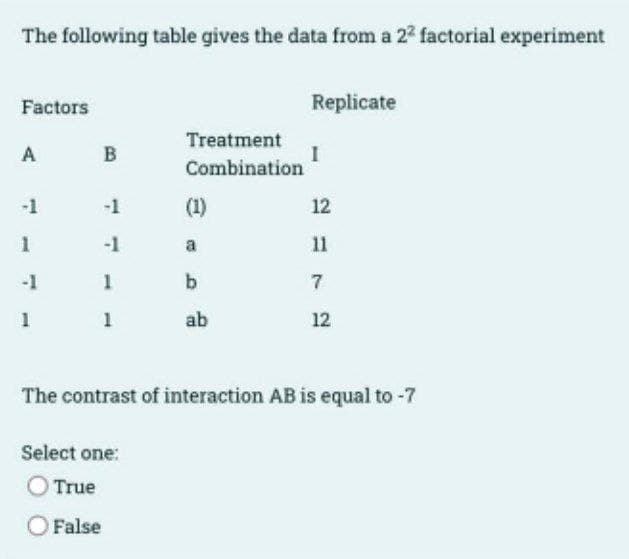
The following table gives the data from a 22 factorial experiment Factors Replicate Treatment A B Combination -1 -1 (1) 12 -1 11 -1 1 b 7 1 1 ab 12 The contrast of interaction AB is equal to -7 Select one: O True O False


Q: 3) ollowing data represent the starting salaries for recently graduated (to the nearest thousand…
A:
Q: Alex decides to go to a casino and play his 3 favorite slot machines. He knows from experience that…
A: A probability is likelihood of occurrence of an event.
Q: Create a standard normal curve for each given, find the areas under the normal curve and shade the…
A:
Q: According to the U.S. Census Bureau, the average household income was $73,298 in 2014 (the latest…
A: Median is kind of average that divides the total data distribution in two equal parts.
Q: After 4 periods the actual results are collected. The following table documents the forecast and…
A: The number of periods is 4.
Q: The regression line for (-3,4), (-2,3),(-1,3),(0,7),(1,5),(2,6),(3,1)
A:
Q: What is the standard deviation of the following sample data: 16, 15, 41, 28, 20, 34. Round to 2…
A:
Q: ow many TV sets? A survey organization sampled 63 households in a community and found that the…
A:
Q: Consider the following regression estimate: In Qd = 2.1 – 0.7 ln P + 0.07Urban Log quantity demanded…
A: Given Information: Regression estimate ln Q^d=2.1-0.7 ln P+0.07Urban The dependent variable is…
Q: Is it reasonable to assume that the conditions for constructing a confidence interval for the mean…
A: From the given data Select the correct choice
Q: A researcher conducts a diagnostic examination to 20 students. The following are the interpretation…
A:
Q: A data set contains information on the grams of fat and number of calories in 25 different fast…
A: Assume that ρ is the population correlation coefficient between the variables.
Q: Duncan test: From the following temperatures of five different environments Env. 1 Env. 2 Env. 3…
A: Given Information: Consider the given dataset: Env. 1 Env.2 Env.3 Env.4 Env.5 14.8 16.1 17.5…
Q: Investigate complete sufficiency when a random sample of size n is taken from (a) Poisson(A) (b)…
A:
Q: For a given disease gene, specified mode of inheritance and observed data set, if the p-value for a…
A: We have given the following statement about the chi - square goodness of fit. P- value = 0.98…
Q: 23.15 a barber runs a one-man shop. he does not make appointments but attends customers on a…
A: Given information: As per guidelines we will only answer the first three subparts, please repost…
Q: A fair and unbiased die is rolled. What is the probability of the event of a number greater than 2…
A:
Q: A survey conducted in a small business yielded the results shown in the table. Test the claim that…
A:
Q: The numbers of hours worked (per week) by 400 statistics students are shown below. Number of Hours…
A: The frequency of the students working less than 20 hours is 40.
Q: A sample of 100 Grade 9 students' ages have been obtained to estimate the mean age of all Grade 9…
A: We have given that, Sample mean (x̄) = 16 , population variance (σ2) = 16 and sample size (n) = 100…
Q: At a music store in New York City, 68 people entering the store were selected at random and were…
A: For the given data Find a) Determine the empirical probability that the next person entering the…
Q: ascertainment bias.... The natural tendency to use surrounding information to resolve ambiguities…
A: We have to choose the statement that best describes the ascertainment bias.
Q: (a) An article in a medical journal suggested that approximately 15% of such operations result in…
A: 15% of operations result in complication; p=0.15 Margin of error=0.03 α=0.002
Q: Teen drivers (those aged 15-19) spend an average of 25 minutes behind the wheel each day. Assume…
A: From the provided information, Mean (µ) = 25 Standard deviation (σ) = 7.6 X~N (25, 7.6)
Q: I. Creatively illustrate and explain the different properties of the standard normal curve. *Write…
A: The properties of the standard normal curve: 1. The Mean, Median, and Mode are all equal. 2. The…
Q: What is the 95% confidence interval for p? -0.930 to 0.805 -0.850 to 0.725 -0.810 to 0.665 -0.890 to…
A: The question is based on confidence int. The Fisher z transformation plays imp. role to calculate…
Q: Find the area, to the nearest thousandth, of the standard normal distribution between the given…
A: From the provided information, The z scores are as follow: z = 0 and z = 1.4
Q: A study found that the mean migration distance of the green turtle was 2200 kilometers and the…
A:
Q: hundredth, for a tire that provided 46,900 mi of wear. z46,900 = (b) The z-score for one tire was…
A: It is given that Mean = 41100 Standard deviation SD = 4700
Q: 3. Which of following statement is NOT correct about p value? a. if p value=0.02, we could tell…
A: Given p-value = 0.02 Concept of p-value If p-value > α we fail to reject the null hypothesis…
Q: The mean can also be thought of as the balance point most common point O point of no return O center…
A: Mean: The arithmetic mean (also called the mean) is the most commonly used measure of central…
Q: A drug test correctly gives a positive result 88 percent of the time. However, 3 percent of the…
A: Introduction: Denote X as the event that a person actually has one or more of the drugs in their…
Q: A newspaper reported decides to sample some schoolchildren to see if they went out trick-or-treating…
A: From the provided information, 61% of kids go out to treat or treat that is (p) = 0.61 Sample size…
Q: ection A. 80 85 75 76 81 76 75 76 76 96 85 78 73 81 89 74 74 76 86 74 90 75 88 79 86 81 90 89 88 85…
A: Given data, For Section A…
Q: 2. Let X~N(u, o2). Show that the MGF of X is etHtc²a².
A:
Q: Monica, a chef at a 5-star restaurant makes eight different desserts. She wants to see if the…
A: The null hypothesis is: H0: All 8 desserts are equally likely to be preferred.
Q: True or false: If the regression equation ln(Qx)=b + BTime + e is estimated using daily data, then…
A: The growth rate of the weekly percentage is defined in terms of exponential function. Exponential…
Q: Let X , Y be two random variables with the following joint probability mass function: X/Y 2 6 -2…
A: Solution-: We have given following table: X\Y 2 6 -2 8 -2 0.109422 0.0270663 0.0223591…
Q: 1. Critical value approach. Fill in the blanks in the table below. Test Statistic Significance Level…
A: As per bartleby guideline expert have to answer first question only dear student please upload other…
Q: The joint probability density of X and Y is f(x, y). Find the marginal density of Y at 0.7. The…
A: The question is based on marginal prob. dist. Given joint prob. density of X and Y : f ( x, y ) = 2…
Q: Refer to the following regression results. The dependent variable is Abort (the number of abortions…
A: 19) The sample size n is 50.
Q: An apple juice producer buys all his apples from a conglomerate of apple growers in one northwest…
A: Given,mean(μ)=2.06standard deviation(σ)=0.16
Q: A researcher wants to carry out a hypothesis test involving the mean for a sample of n = 20. While…
A: The objective is to interpret the validity of the provided test statistic, for which the hypothesis…
Q: 10. When is a Type I error committed? A. We reject a null hypothesis that is true. B. We reject a…
A:
Q: Example of negative correlation
A:
Q: A sample of 50 provided a sample mean of 19.4. The population standard deviation is 2. (a) Find the…
A: here use given null and alternative hypothesis and basic of hypothesis testing here population…
Q: In a poll of 517 human resource professionals, 45.8% said that body piercings and tattoos were big…
A: A poll of 517 human resource professionals; n=517 45.8% said that body piercings and tattoos were…
Q: The following is the frequency distribution for the speeds of a sample of automobiles traveling on…
A: Note: According to Bartleby guidelines expert solve only one question and rest can be reposted.
Q: According to a report done by S&J Power, the mean lifetime of the light bulbs it manufactures is 45…
A: It is given that the mean lifetime of the light bulbs it manufactures is 45 months.
Q: n using SPSS/Minitab
A: Given information: Sodium content of 26 randomly picked canned food. MINITAB From the output, The…

Step by step
Solved in 2 steps with 1 images

- SO what would be the L, Lq, and Wq of this problem? Assuming we are trying to develop and sovle a waiting line system that can accomodate this increased leel of passenger traffic.In a clinical trial, 2828 out of 887887 patients taking a prescription drug daily complained of flulike symptoms. Suppose that it is known that 2.62.6% of patients taking competing drugs complain of flulike symptoms. Is there sufficient evidence to conclude that more than 2.62.6% of this drug's users experience flulike symptoms as a side effect at the alpha equals 0.05α=0.05 level of significance?Because np 0 left parenthesis 1 minus p 0 right parenthesisnp01−p0equals= nothing▼ 10, the sample size is ▼less thanless than greater thangreater than 5% of the population size, and the sample ▼can be reasonably assumed to be random, is given to be random, is given to not be random, cannot be reasonably assumed to be random, the requirements for testing the hypothesis ▼are not are satisfied.(Round to one decimal place as needed.)Enter your answer in the answer box and then click Check Answer.What effects appear to be present for this factorial design? B1 B2 A1 10 5 A2 10 15 Main effect for A; No main effect for B; No AxB interaction Main effect for A; Main effect for B; AxB interaction Main effect for A; No main effect for B; AxB interaction No main effect for A; Main effect for B; AxB interaction
- Suppose a researcher compares the means of two independent groups that have the same number of participants in each group. The researcher uses the .05 level of significance and obtains a calculated value of t of 2.11. At least how many participants must be in each group in order to reject the null hypothesis?A. 10B. 9C. 8D. 11The manufacturer of a gasoline additive claims that the use of this additive increases’gasoline mileage. A random sample of 6 cars was selected, and these cars were drivenfor one week without the gasoline additive and then for one week with the additive.The following table gives the mileage (in miles per gallon) for these cars with andwithout the additive: car 1 2 3 4 5 6 mileage without additive 24.6 28.3 18.9 23.7 15.4 29.5 mileage with additive 26.3 31.7 18.2 25.3 18.3 30.9 Assuming mileage are normally distributed, can you conclude that the use of thegasoline additive increases mileage at the 2.5% significance level?In a study of a group of women science majors who remained in their profession and a group who left their profession within a few months of graduation, the researchers collected the data shown here on a self-esteem questionnaire. Leavers Stayers1 = 3.05 2 = 2.92σ1 = 0.71 σ2 = 0.71n1 = 100 n2 = 227At α = 0.05, can it be concluded that there is a difference in the self-esteem scores of the two groups? Use the P-value method.
- Consider the following datax -5 -4 -3 -2 -1 0 1 2 3 4 5Y - 125 - 64 - 27 -8 -1 0 1 8 27 64 125a. Calculate the correlation between x and y, and perform a hypothesis test to determine if the correlation is significantly greater than zero. Use a significance level of 5%.b. Are you willing to conclude that there is a strong linear association between the two variables? Use at least one graph to support your answer, and to explain why or why not.A sample of men and women who had passed their driver's test either the first time or the second time were surveyed, with the following results: Results of the driving testGender First time Second timeMen 126 211Women 135 178a) Do these data suggest that there is a relationship between gender and the passing of their driver’s test from which the present sample was drawn? Let alpha=.05A researcher is using a two-tailed hypothesis test with α = 0.01 to evaluate the effect of a treatment. If theboundaries for the critical region are t = ± 2.845, then how many individuals are in the sample?A. n = 23B. n = 22C. n = 21D. n = 20E. cannot be determined from the information given
- A paper investigated the driving behavior of teenagers by observing their vehicles as they left a high school parking lot and then again at a site approximately 1 2 mile from the school. Assume that it is reasonable to regard the teen drivers in this study as representative of the population of teen drivers. MaleDriver FemaleDriver 1.3 -0.3 1.3 0.6 0.9 1.1 2.1 0.7 0.7 1.1 1.3 1.2 3 0.1 1.3 0.9 0.6 0.5 2.1 0.5 (a) Use a .01 level of significance for any hypothesis tests. Data consistent with summary quantities appearing in the paper are given in the table. The measurements represent the difference between the observed vehicle speed and the posted speed limit (in miles per hour) for a sample of male teenage drivers and a sample of female teenage drivers. (Use ?males − ?females. Round your test statistic to two decimal places. Round your degrees of freedom down to the nearest whole number. Round your p-value to three decimal places.) t = df =…The following table presents results from a simulated shopping and in-home product use test for a new toilet tissue from P&G's Charmin. The new brand, Charmin All Purpose, was positioned to compete against Private Labels (store brands) and as such was priced lower than brand Charmin. Stimulated Shopping Call Back Charmin All Purpose Charmin Private Label Totals Charmin All Purpose 100 80 20 200 Charmin 50 300 50 400 Private Label 50 100 250 400 200 480 320 1000 Assume the P&G is comfortable that 95% of households will be aware of the new Charmin brand and that it will have an ACV of .95. What is your estimate of the first year share that Charmin All Purpose will achieve? What, if any, are the positives coming out of this test? What, if any, are the negatives?A paper investigated the driving behavior of teenagers by observing their vehicles as they left a high school parking lot and then again at a site approximately 1 2 mile from the school. Assume that it is reasonable to regard the teen drivers in this study as representative of the population of teen drivers. MaleDriver FemaleDriver 1.4 -0.2 1.2 0.5 0.9 1.1 2.1 0.7 0.7 1.1 1.3 1.2 3 0.1 1.3 0.9 0.6 0.5 2.1 0.5 (a) Use a .01 level of significance for any hypothesis tests. Data consistent with summary quantities appearing in the paper are given in the table. The measurements represent the difference between the observed vehicle speed and the posted speed limit (in miles per hour) for a sample of male teenage drivers and a sample of female teenage drivers. (Use ?males − ?females. Round your test statistic to two decimal places. Round your degrees of freedom down to the nearest whole number. Round your p-value to three decimal places.) t = df =…


