The body temperatures of a group of healthy adults have a bell-shaped distribution with a mean of 98.15°F and a standard deviation of 0.67°F. Using the empirical rule, find each approximate percentage below. a. What is the approximate percentage of healthy adults with body temperatures within 3 standard deviations of the mean, or between 96.14°F and 100.16°F? b. What is the approximate percentage of healthy adults with body temperatures between 96.81°F and 99.49°F? a. Approximately % of healthy adults in this group have body temperatures within 3 standard deviations of the mean, or between 96.14°F and 100.16°F. (Type an integer or a decimal. Do not round.) b. Approximately% of healthy adults in this group have body temperatures between 96.81°F and 99.49°F. (Type an integer or a decimal. Do not round.)
The body temperatures of a group of healthy adults have a bell-shaped distribution with a mean of 98.15°F and a standard deviation of 0.67°F. Using the empirical rule, find each approximate percentage below. a. What is the approximate percentage of healthy adults with body temperatures within 3 standard deviations of the mean, or between 96.14°F and 100.16°F? b. What is the approximate percentage of healthy adults with body temperatures between 96.81°F and 99.49°F? a. Approximately % of healthy adults in this group have body temperatures within 3 standard deviations of the mean, or between 96.14°F and 100.16°F. (Type an integer or a decimal. Do not round.) b. Approximately% of healthy adults in this group have body temperatures between 96.81°F and 99.49°F. (Type an integer or a decimal. Do not round.)

Glencoe Algebra 1, Student Edition, 9780079039897, 0079039898, 2018
18th Edition
ISBN:9780079039897
Author:Carter
Publisher:Carter
Chapter10: Statistics
Section10.4: Distributions Of Data
Problem 19PFA

Related questions

Question
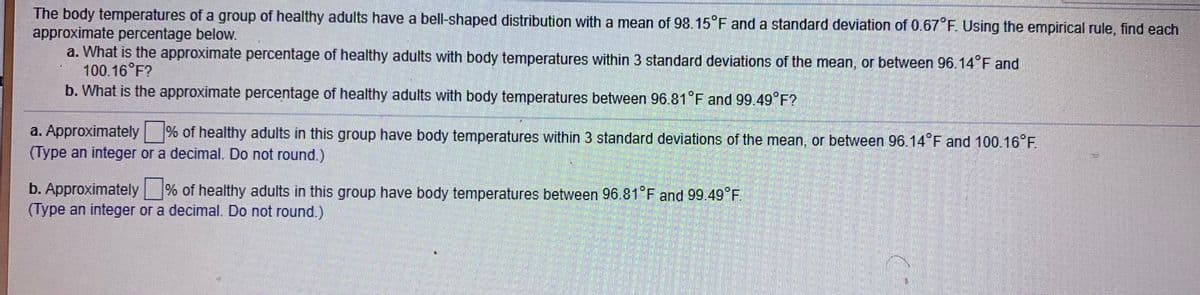
Transcribed Image Text:The body temperatures of a group of healthy adults have a bell-shaped distribution with a mean of 98.15°F and a standard deviation of 0.67 F. Using the empirical rule, find each
approximate percentage below.
a. What is the approximate percentage of healthy adults with body temperatures within 3 standard deviations of the mean, or between 96.14 F and
100.16 F?
b. What is the approximate percentage of healthy adults with body temperatures between 96.81°F and 99.49°F?
a. Approximately % of healthy adults in this group have body temperatures within 3 standard deviations of the mean, or between 96 14 F and 100.16°F.
(Type an integer or a decimal. Do not round.)
b. Approximately % of healthy adults in this group have body temperatures between 96.81 F and 99.49 F.
(Type an integer or a decimal. Do not round.)
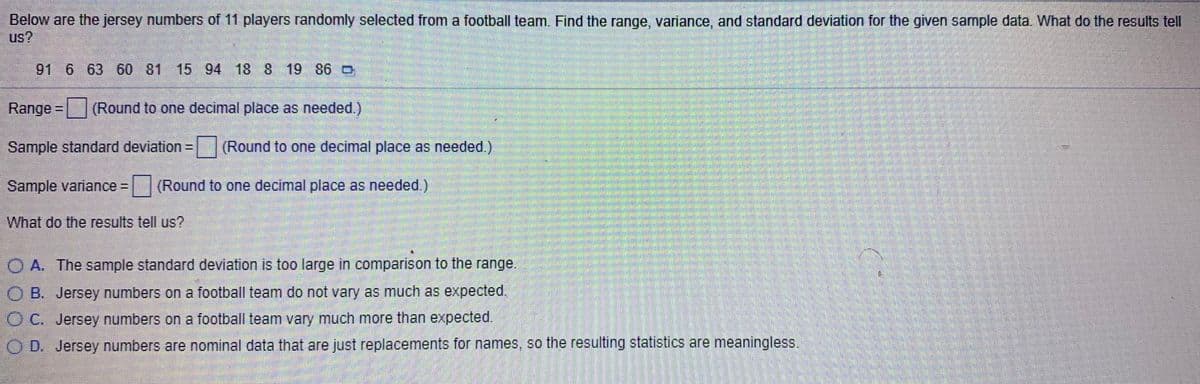
Transcribed Image Text:Below are the jersey numbers of 11 players randomly selected from a football team. Find the range, variance, and standard deviation for the given sample data. What do the results tell
us?
91 6 63 60 81 15 94 18 8 19 86 O
Range =
(Round to one decimal place as needed.)
Sample standard deviation (Round to one decimal place as needed.)
Sample variance =
| (Round to one decimal place as needed.)
What do the results tell us?
O A. The sample standard deviation is too large in comparison to the range.
OB. Jersey numbers on a football team do not vary as much as expected.
OC. Jersey numbers on a football team vary much more than expected.
D. Jersey numbers are nominal data that are just replacements for names, so the resulting statistics are meaningless.
Expert Solution
This question has been solved!
Explore an expertly crafted, step-by-step solution for a thorough understanding of key concepts.

This is a popular solution!

Trending now
This is a popular solution!

Step by step
Solved in 3 steps with 2 images

Knowledge Booster


Learn more about
Need a deep-dive on the concept behind this application? Look no further. Learn more about this topic, statistics and related others by exploring similar questions and additional content below.Recommended textbooks for you
Glencoe Algebra 1, Student Edition, 9780079039897…
Algebra
ISBN:
9780079039897
Author:
Carter
Publisher:
McGraw Hill
Glencoe Algebra 1, Student Edition, 9780079039897…
Algebra
ISBN:
9780079039897
Author:
Carter
Publisher:
McGraw Hill