Construct the stem-and-leaf plot. Choose the correct answer below. TETE DE DE O A. O B. O C. Stem Leaves Stem Leaves Stem Leaves Stem Leaves 6. 7 6. 26 25 25 25 8. 6 698 8. 6996 8 6899 8. 6998 6. 0 9 9 0 8 9. 0 8 9. 0 7 10 10 10 10 How does the stem-and-leaf plot show the distribution of these data? OA. The lengths of the rows are similar to the widths of bars in a histogram; longer rows of data correspond to smaller frequencies. B. The lengths of the rows are similar to the heights of bars in a histogram3B longer rows of data correspond to higher frequencies. The lenathe of thn
Construct the stem-and-leaf plot. Choose the correct answer below. TETE DE DE O A. O B. O C. Stem Leaves Stem Leaves Stem Leaves Stem Leaves 6. 7 6. 26 25 25 25 8. 6 698 8. 6996 8 6899 8. 6998 6. 0 9 9 0 8 9. 0 8 9. 0 7 10 10 10 10 How does the stem-and-leaf plot show the distribution of these data? OA. The lengths of the rows are similar to the widths of bars in a histogram; longer rows of data correspond to smaller frequencies. B. The lengths of the rows are similar to the heights of bars in a histogram3B longer rows of data correspond to higher frequencies. The lenathe of thn

MATLAB: An Introduction with Applications
6th Edition
ISBN:9781119256830
Author:Amos Gilat
Publisher:Amos Gilat
Chapter1: Starting With Matlab
Section: Chapter Questions
Problem 1P

Related questions
Question
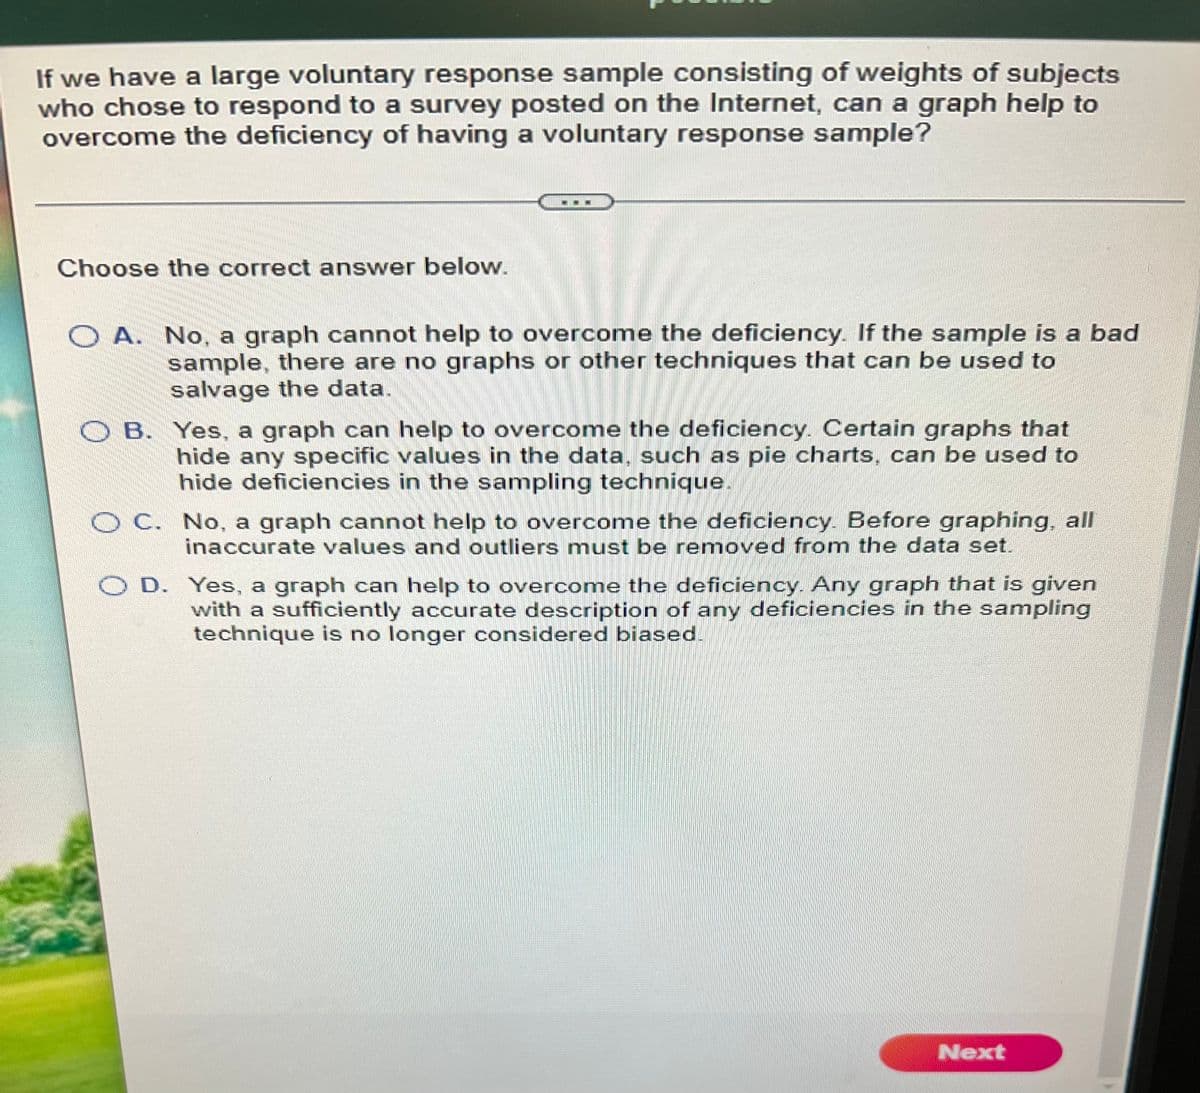
Transcribed Image Text:If we have a large voluntary response sample consisting of weights of subjects
who chose to respond to a survey posted on the Internet, can a graph help to
overcome the deficiency of having a voluntary response sample?
Choose the correct answer below.
O A. No, a graph cannot help to overcome the deficiency. If the sample is a bad
sample, there are no graphs or other techniques that can be used to
salvage the data.
O B. Yes, a graph can help to overcome the deficiency. Certain graphs that
hide any specific values in the data, such as pie charts, can be used to
hide deficiencies in the sampling technique.
O C. No, a graph cannot help to overcome the deficiency Before graphing, all
inaccurate values and outliers must be removed from the data set.
O D. Yes, a graph can help to overcome the deficiency. Any graph that is given
with a sufficiently accurate description of any deficiencies in the sampling
technique is no longer considered biased.
Next
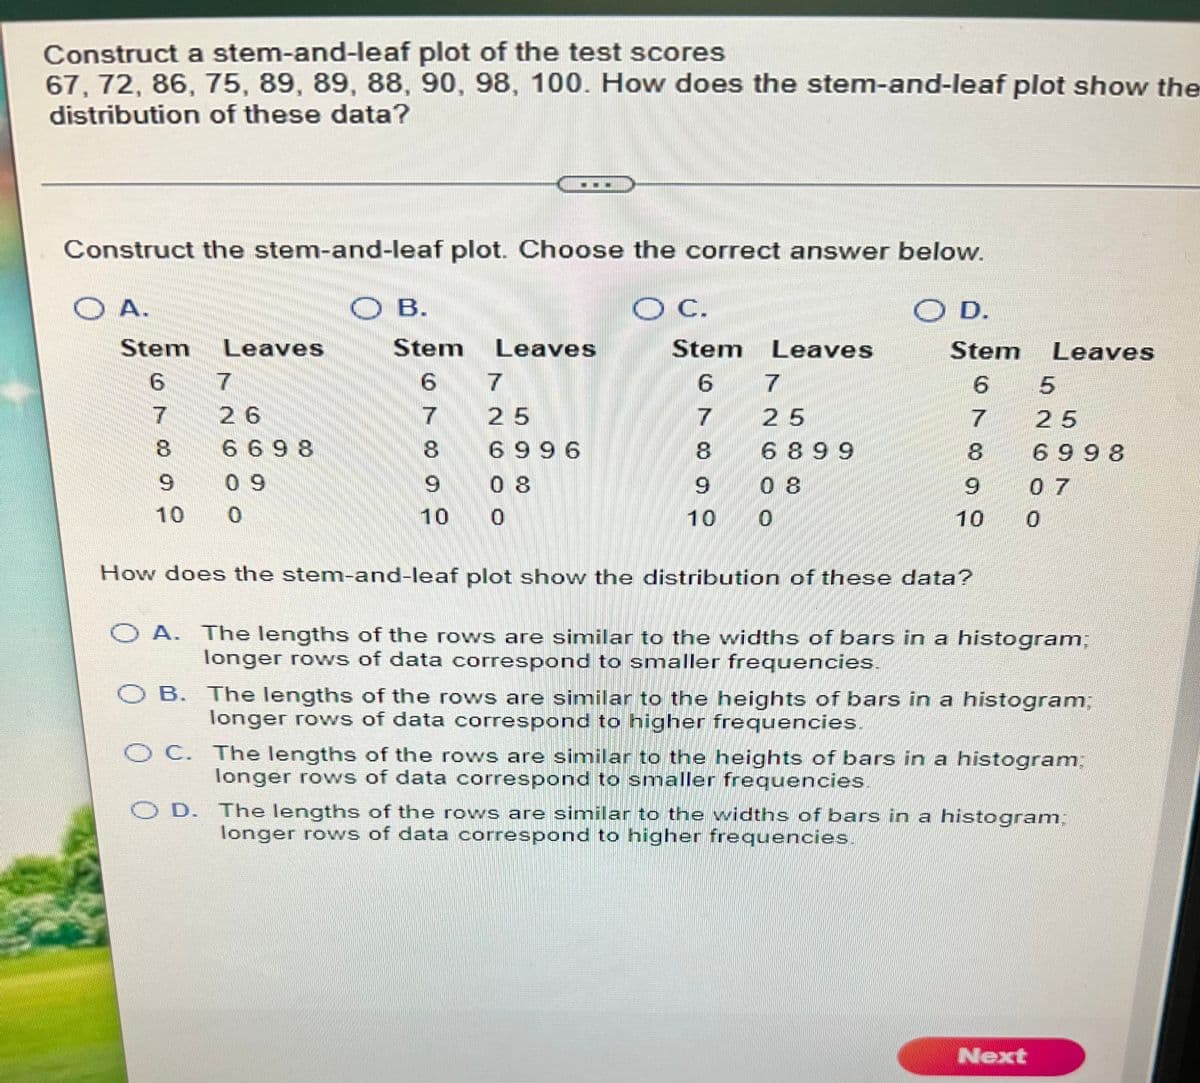
Transcribed Image Text:Construct a stem-and-leaf plot of the test scores
67, 72, 86, 75, 89, 89, 88, 90, 98, 100. How does the stem-and-leaf plot show the
distribution of these data?
Construct the stem-and-leaf plot. Choose the correct answer below.
O A.
B.
O B.
C.
D.
O D.
Stem
Leaves
Stem
Leaves
Stem Leaves
Stem
Leaves
9.
9.
7
6.
26
25
25
25
669 8
8.
6 996
8.
6 899
6 998
6.
0 9
0 8
6.
0 8
6.
07
10
10
10
10
How does the stem-and-leaf plot show the distribution of these data?
O A. The lengths of the rows are similar to the widths of bars in a histogram;
longer rows of data correspond to smaller frequencies.
O B. The lengths of the rows are similar to the heights of bars in a histogram%3B
longer rows of data correspond to higher frequencies.
O C. The lengths of the rows are similar to the heights of bars in a histogramB
longer rows of data correspond to smaller frequencies.
O D. The lengths of the rows are similar to the widths of bars in a histogram;
longer rows of data correspond to higher frequencies,
Next
Expert Solution
This question has been solved!
Explore an expertly crafted, step-by-step solution for a thorough understanding of key concepts.

This is a popular solution!

Trending now
This is a popular solution!

Step by step
Solved in 2 steps

Recommended textbooks for you
MATLAB: An Introduction with Applications
Statistics
ISBN:
9781119256830
Author:
Amos Gilat
Publisher:
John Wiley & Sons Inc

Probability and Statistics for Engineering and th…
Statistics
ISBN:
9781305251809
Author:
Jay L. Devore
Publisher:
Cengage Learning

Statistics for The Behavioral Sciences (MindTap C…
Statistics
ISBN:
9781305504912
Author:
Frederick J Gravetter, Larry B. Wallnau
Publisher:
Cengage Learning
MATLAB: An Introduction with Applications
Statistics
ISBN:
9781119256830
Author:
Amos Gilat
Publisher:
John Wiley & Sons Inc
Probability and Statistics for Engineering and th…
Statistics
ISBN:
9781305251809
Author:
Jay L. Devore
Publisher:
Cengage Learning
Statistics for The Behavioral Sciences (MindTap C…
Statistics
ISBN:
9781305504912
Author:
Frederick J Gravetter, Larry B. Wallnau
Publisher:
Cengage Learning

Elementary Statistics: Picturing the World (7th E…
Statistics
ISBN:
9780134683416
Author:
Ron Larson, Betsy Farber
Publisher:
PEARSON

The Basic Practice of Statistics
Statistics
ISBN:
9781319042578
Author:
David S. Moore, William I. Notz, Michael A. Fligner
Publisher:
W. H. Freeman

Introduction to the Practice of Statistics
Statistics
ISBN:
9781319013387
Author:
David S. Moore, George P. McCabe, Bruce A. Craig
Publisher:
W. H. Freeman