The boxplot summarizes the daily high temperatures, in degrees Fahrenheit (°F), in Preston, Idaho, for April 2020. DAILY HIGH TEMPERATURES (°F) FOR APRIL 2020 IN PRESTON, IDAHO 35 51 61 66 81 +++ 35 40 45 50 55 60 65 70 75 80 85 Temperatures (°F) If one of the high temperatures were to be selected at random, which of the following statements is true? A The temperature is most likely to be between the minimum and quartile 1 because it has the greatest range of data values. The temperature is most likely to be between the median and quartile 3 because it has the greatest density of data values. The temperature is most likely to be between quartile 3 and the maximum because it has the greatest data values contained within it. The temperature is equally likely to be between the minimum and quartile 1, quartile 1 and the median, the median and quartile 3, or quartile 3 and the maximum.
The boxplot summarizes the daily high temperatures, in degrees Fahrenheit (°F), in Preston, Idaho, for April 2020. DAILY HIGH TEMPERATURES (°F) FOR APRIL 2020 IN PRESTON, IDAHO 35 51 61 66 81 +++ 35 40 45 50 55 60 65 70 75 80 85 Temperatures (°F) If one of the high temperatures were to be selected at random, which of the following statements is true? A The temperature is most likely to be between the minimum and quartile 1 because it has the greatest range of data values. The temperature is most likely to be between the median and quartile 3 because it has the greatest density of data values. The temperature is most likely to be between quartile 3 and the maximum because it has the greatest data values contained within it. The temperature is equally likely to be between the minimum and quartile 1, quartile 1 and the median, the median and quartile 3, or quartile 3 and the maximum.

College Algebra (MindTap Course List)
12th Edition
ISBN:9781305652231
Author:R. David Gustafson, Jeff Hughes
Publisher:R. David Gustafson, Jeff Hughes
Chapter8: Sequences, Series, And Probability
Section8.7: Probability
Problem 46E: Assume that a survey of 282 people is taken to determine the opinions of doctors, teachers, and...

Related questions
Question
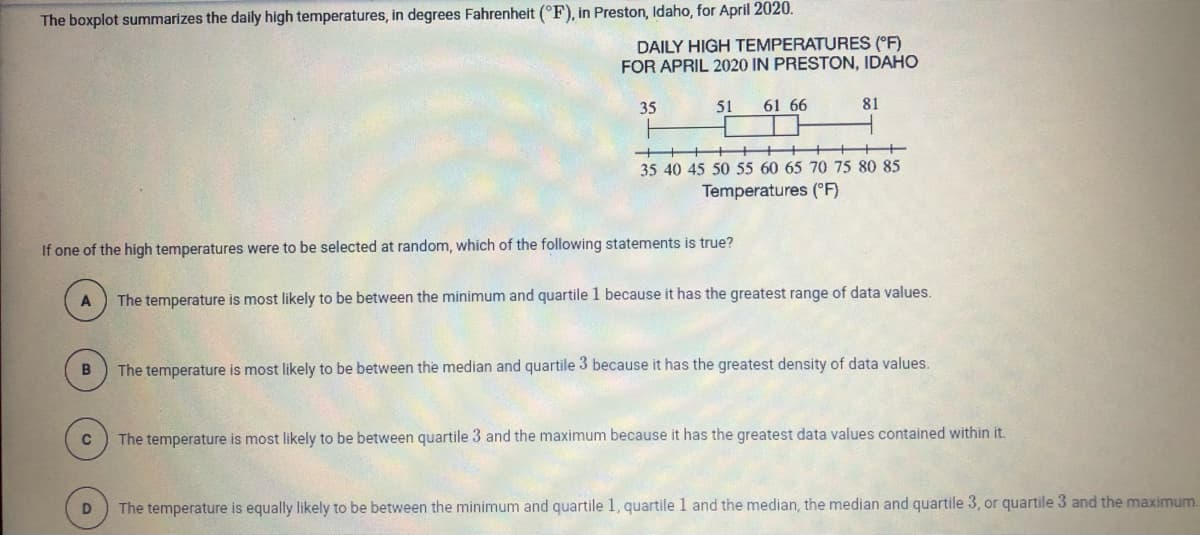
Transcribed Image Text:The boxplot summarizes the daily high temperatures, in degrees Fahrenheit (°F), in Preston, Idaho, for April 2020.
DAILY HIGH TEMPERATURES (°F)
FOR APRIL 2020 IN PRESTON, IDAHO
35
51
61 66
81
35 40 45 50 55 60 65 70 75 80 85
Temperatures (°F)
If one of the high temperatures were to be selected at random, which of the following statements is true?
A
The temperature is most likely to be between the minimum and quartile 1 because it has the greatest range of data values.
The temperature is most likely to be between the median and quartile 3 because it has the greatest density of data values.
The temperature is most likely to be between quartile 3 and the maximum because it has the greatest data values contained within it.
The temperature is equally likely to be between the minimum and quartile 1, quartile 1 and the median, the median and quartile 3, or quartile 3 and the maximum.
Expert Solution
This question has been solved!
Explore an expertly crafted, step-by-step solution for a thorough understanding of key concepts.

Step by step
Solved in 2 steps with 2 images

Recommended textbooks for you
College Algebra (MindTap Course List)
Algebra
ISBN:
9781305652231
Author:
R. David Gustafson, Jeff Hughes
Publisher:
Cengage Learning

Holt Mcdougal Larson Pre-algebra: Student Edition…
Algebra
ISBN:
9780547587776
Author:
HOLT MCDOUGAL
Publisher:
HOLT MCDOUGAL
College Algebra (MindTap Course List)
Algebra
ISBN:
9781305652231
Author:
R. David Gustafson, Jeff Hughes
Publisher:
Cengage Learning
Holt Mcdougal Larson Pre-algebra: Student Edition…
Algebra
ISBN:
9780547587776
Author:
HOLT MCDOUGAL
Publisher:
HOLT MCDOUGAL