The British Department of Transportation studied to see if people avoid driving on Friday the 13th. They did a traffic count on a Friday and then again on a Friday the 13th at the same two locations. The data for each location on the two different dates is in the table. Do the data show that on average fewer people drive on Friday the 13th? Test at the 5% level. Traffic Count Dates 1990, July 1990, July 1991, September 6th 13th 137669 135825 129699 128891 136898 138275 1991, September 138966 139940 1991, December 132021 129640 1991, December 119268 119214 1992, March 131938 131104 1992, March 123306 124760 1992, November 129499 129219 1992, November 138568 135934 State the null and alternative hypotheses. Ho: Hd? Ha: Ha? Calculate the test statistic. Round to four decimal places. d = Calculate the standardized test statistic. Round three decimal places. t = Find the p-value. Round to four decimal places. p-value =
The British Department of Transportation studied to see if people avoid driving on Friday the 13th. They did a traffic count on a Friday and then again on a Friday the 13th at the same two locations. The data for each location on the two different dates is in the table. Do the data show that on average fewer people drive on Friday the 13th? Test at the 5% level. Traffic Count Dates 1990, July 1990, July 1991, September 6th 13th 137669 135825 129699 128891 136898 138275 1991, September 138966 139940 1991, December 132021 129640 1991, December 119268 119214 1992, March 131938 131104 1992, March 123306 124760 1992, November 129499 129219 1992, November 138568 135934 State the null and alternative hypotheses. Ho: Hd? Ha: Ha? Calculate the test statistic. Round to four decimal places. d = Calculate the standardized test statistic. Round three decimal places. t = Find the p-value. Round to four decimal places. p-value =

Glencoe Algebra 1, Student Edition, 9780079039897, 0079039898, 2018
18th Edition
ISBN:9780079039897
Author:Carter
Publisher:Carter
Chapter10: Statistics
Section10.6: Summarizing Categorical Data
Problem 10CYU

Related questions
Question
100%
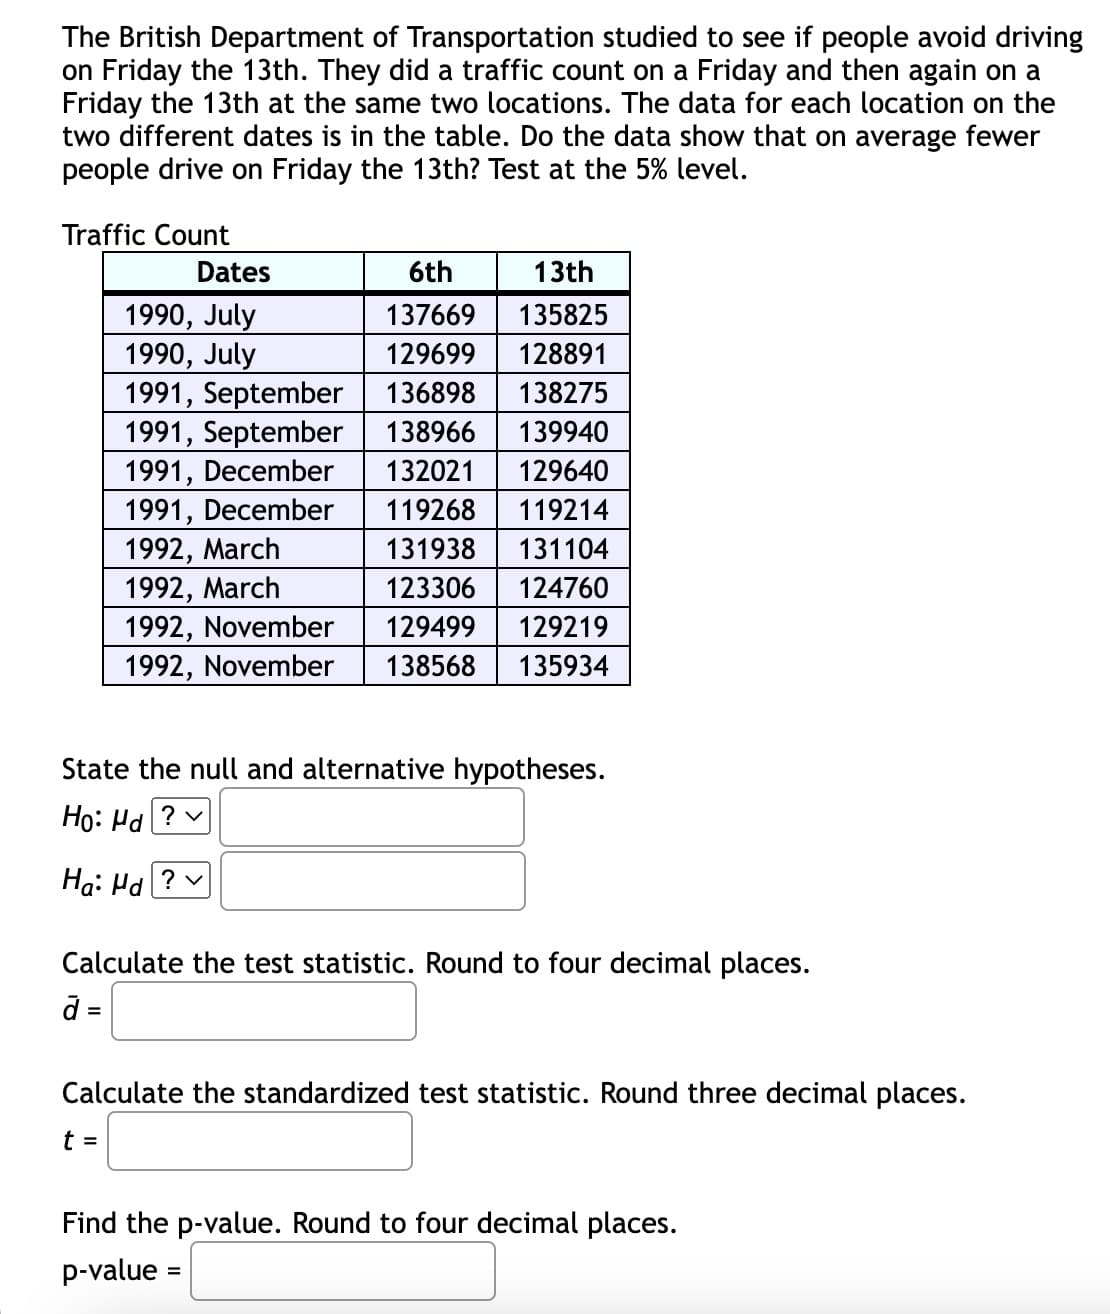
The British Department of Transportation studied to see if people avoid driving on Friday the 13th. They did a traffic count on a Friday and then again on a Friday the 13th at the same two locations. The data for each location on the two different dates is in the table. Do the data show that on average fewer people drive on Friday the 13th? Test at the 5% level.
Traffic Count
| Dates | 6th | 13th |
|---|---|---|
| 1990, July | 137669 | 135825 |
| 1990, July | 129699 | 128891 |
| 1991, September | 136898 | 138275 |
| 1991, September | 138966 | 139940 |
| 1991, December | 132021 | 129640 |
| 1991, December | 119268 | 119214 |
| 1992, March | 131938 | 131104 |
| 1992, March | 123306 | 124760 |
| 1992, November | 129499 | 129219 |
| 1992, November | 138568 |
135934
|
Transcribed Image Text:The British Department of Transportation studied to see if people avoid driving
on Friday the 13th. They did a traffic count on a Friday and then again on a
Friday the 13th at the same two locations. The data for each location on the
two different dates is in the table. Do the data show that on average fewer
people drive on Friday the 13th? Test at the 5% level.
Traffic Count
6th
13th
1990, July
137669
135825
1990, July
129699
128891
1991, September
136898
138275
1991, September
138966
139940
1991, December 132021 129640
1991, December
119268
119214
1992, March
131938
131104
1992, March
123306
124760
1992, November
129499 129219
1992, November 138568 135934
Dates
State the null and alternative hypotheses.
Ho: Ha?
Ha: Hd ? ✓
Calculate the test statistic. Round to four decimal places.
d =
Calculate the standardized test statistic. Round three decimal places.
t =
Find the p-value. Round to four decimal places.
p-value
Expert Solution
This question has been solved!
Explore an expertly crafted, step-by-step solution for a thorough understanding of key concepts.

Step by step
Solved in 3 steps

Recommended textbooks for you
Glencoe Algebra 1, Student Edition, 9780079039897…
Algebra
ISBN:
9780079039897
Author:
Carter
Publisher:
McGraw Hill

Holt Mcdougal Larson Pre-algebra: Student Edition…
Algebra
ISBN:
9780547587776
Author:
HOLT MCDOUGAL
Publisher:
HOLT MCDOUGAL
Glencoe Algebra 1, Student Edition, 9780079039897…
Algebra
ISBN:
9780079039897
Author:
Carter
Publisher:
McGraw Hill
Holt Mcdougal Larson Pre-algebra: Student Edition…
Algebra
ISBN:
9780547587776
Author:
HOLT MCDOUGAL
Publisher:
HOLT MCDOUGAL