The capacities at which U.S. nuclear power plants are working are shown in table for various years. Year Percent 1975 56 1980 59 1985 58 1990 70 1995 76 2000 88 2004 89 Let f(t) be the capacity (in percent) at which U.S. nuclear power plants are working at t years since 1970. Use Quadratic regression on your calculator to find a quadratic function that models this data. Round each coefficient to at least 3 decimal places. BE SURE TO USE t = 0 to represent the 1 would be 1971, and so on: year 1970. Then t Equation f(t) : Use your graphing calculator to draw the graph of the model and, in the same viewing window, the scattergram of the data. Does the model fit the data well? The function is a good model for the data. The function is not a good model for the data Estimate at what capacity U. S. nuclear power plants were working in 2013. % Round to the nearest whole percent. Predict when U. S. nuclear power plants will be working at full (100%) capacity. Enter the year this occurs.
The capacities at which U.S. nuclear power plants are working are shown in table for various years. Year Percent 1975 56 1980 59 1985 58 1990 70 1995 76 2000 88 2004 89 Let f(t) be the capacity (in percent) at which U.S. nuclear power plants are working at t years since 1970. Use Quadratic regression on your calculator to find a quadratic function that models this data. Round each coefficient to at least 3 decimal places. BE SURE TO USE t = 0 to represent the 1 would be 1971, and so on: year 1970. Then t Equation f(t) : Use your graphing calculator to draw the graph of the model and, in the same viewing window, the scattergram of the data. Does the model fit the data well? The function is a good model for the data. The function is not a good model for the data Estimate at what capacity U. S. nuclear power plants were working in 2013. % Round to the nearest whole percent. Predict when U. S. nuclear power plants will be working at full (100%) capacity. Enter the year this occurs.

Algebra & Trigonometry with Analytic Geometry
13th Edition
ISBN:9781133382119
Author:Swokowski
Publisher:Swokowski
Chapter7: Analytic Trigonometry
Section7.6: The Inverse Trigonometric Functions
Problem 94E

Related questions
Question
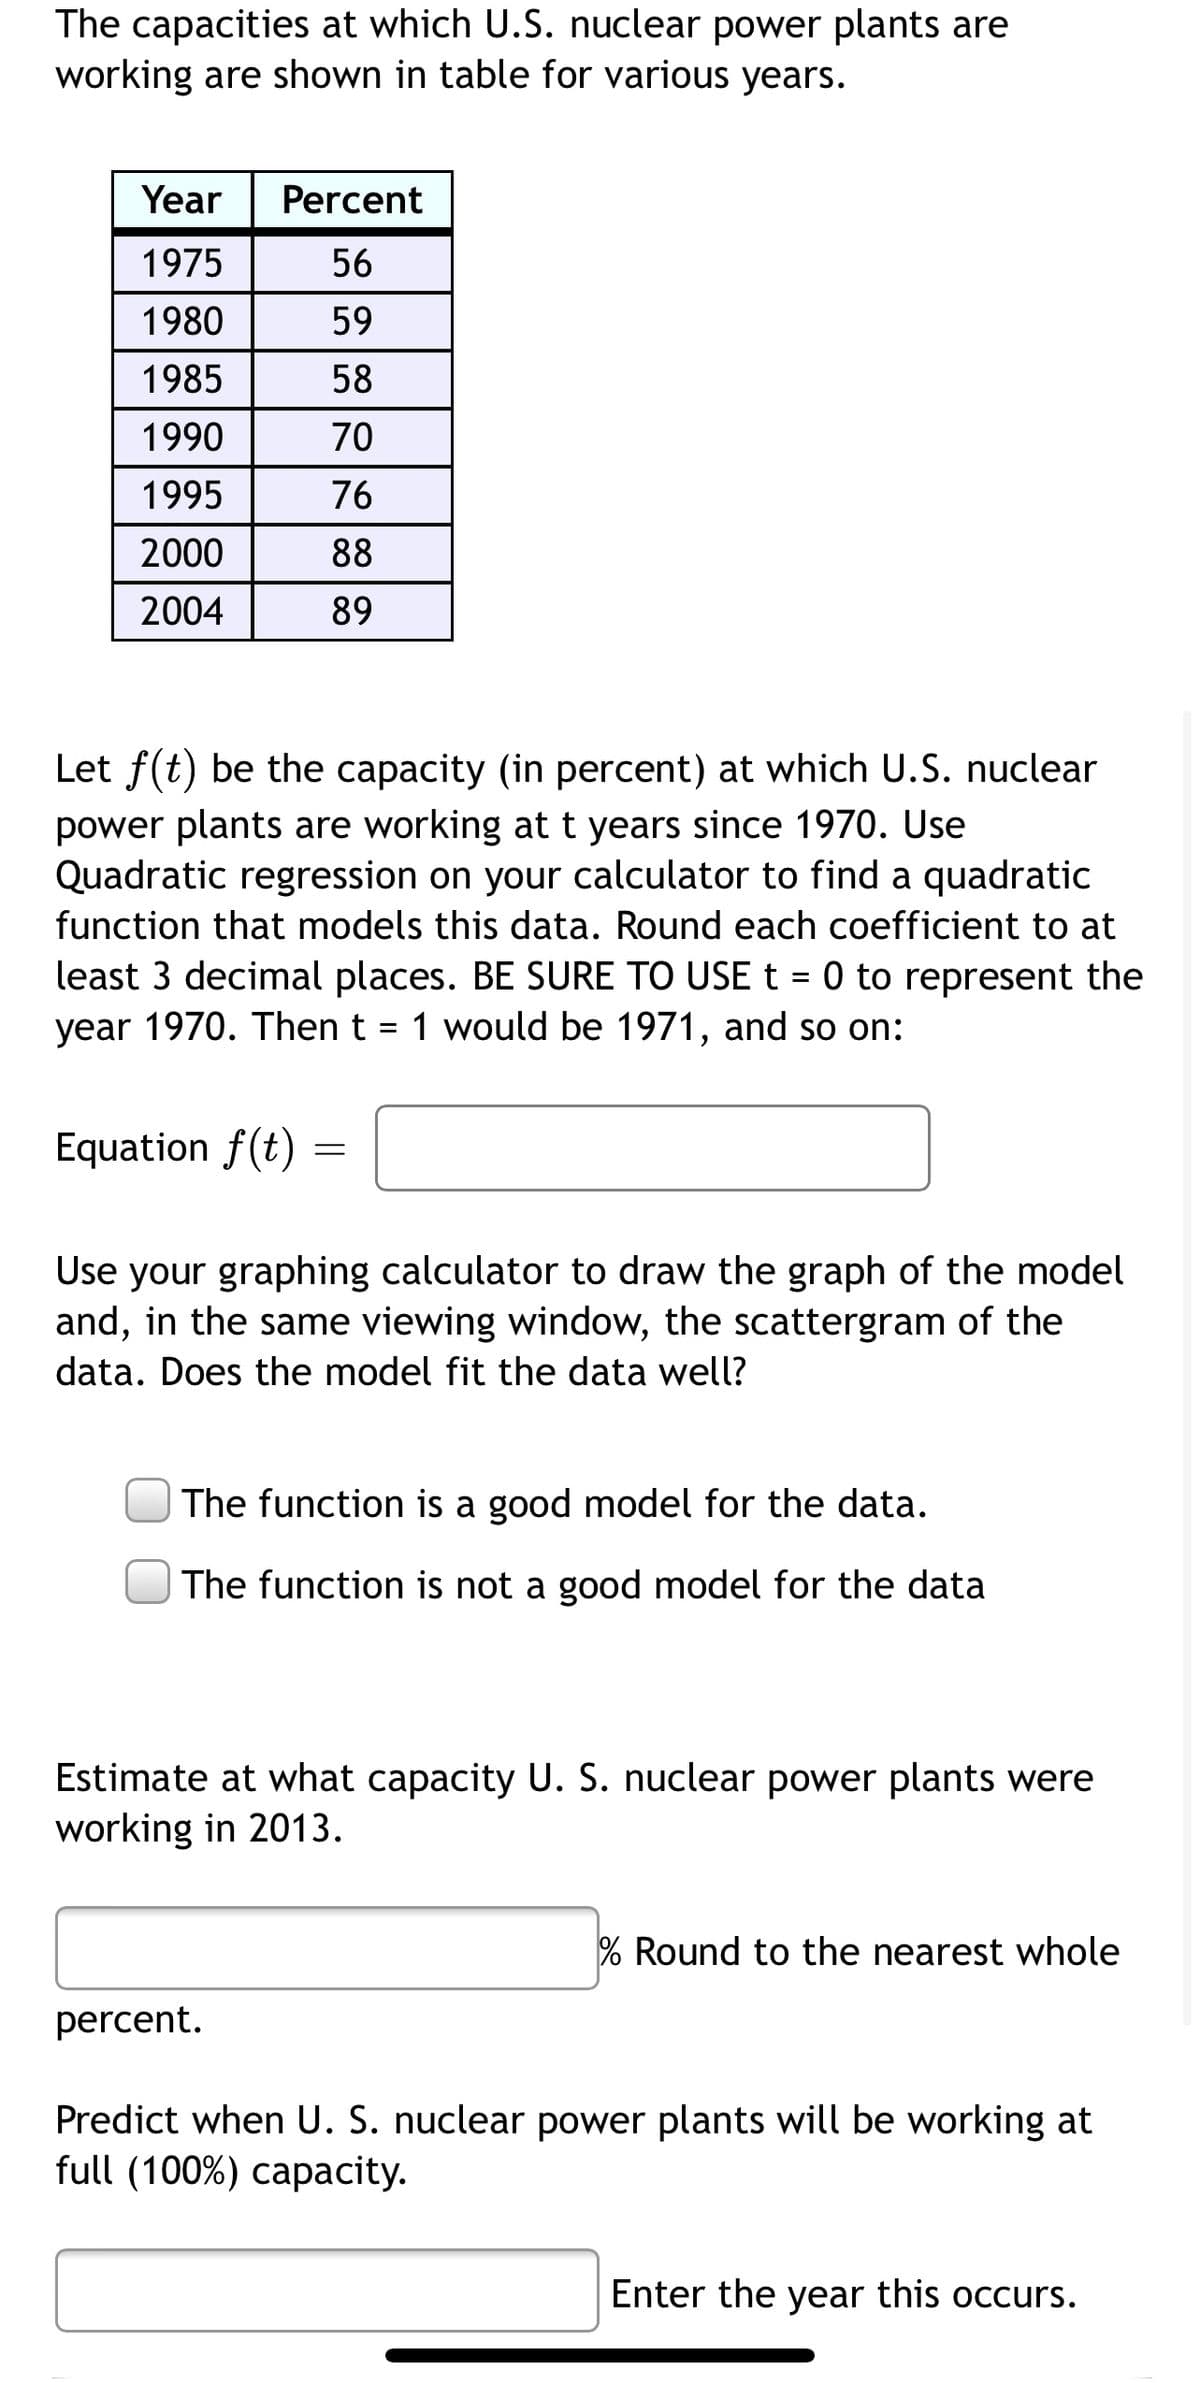
Transcribed Image Text:The capacities at which U.S. nuclear power plants are
working are shown in table for various years.
Year
Percent
1975
56
1980
59
1985
58
1990
70
1995
76
2000
88
2004
89
Let f(t) be the capacity (in percent) at which U.S. nuclear
power plants are working at t years since 1970. Use
Quadratic regression on your calculator to find a quadratic
function that models this data. Round each coefficient to at
least 3 decimal places. BE SURE TO USE t = 0 to represent the
year 1970. Then t = 1 would be 1971, and so on:
Equation f(t) =
Use your graphing calculator to draw the graph of the model
and, in the same viewing window, the scattergram of the
data. Does the model fit the data well?
The function is a good model for the data.
The function is not a good model for the data
Estimate at what capacity U. S. nuclear power plants were
working in 2013.
% Round to the nearest whole
percent.
Predict when U. S. nuclear power plants will be working at
full (100%) capacity.
Enter the year this occurs.
Expert Solution
This question has been solved!
Explore an expertly crafted, step-by-step solution for a thorough understanding of key concepts.

This is a popular solution!

Trending now
This is a popular solution!

Step by step
Solved in 5 steps with 4 images

Recommended textbooks for you
Algebra & Trigonometry with Analytic Geometry
Algebra
ISBN:
9781133382119
Author:
Swokowski
Publisher:
Cengage


College Algebra (MindTap Course List)
Algebra
ISBN:
9781305652231
Author:
R. David Gustafson, Jeff Hughes
Publisher:
Cengage Learning
Algebra & Trigonometry with Analytic Geometry
Algebra
ISBN:
9781133382119
Author:
Swokowski
Publisher:
Cengage
College Algebra (MindTap Course List)
Algebra
ISBN:
9781305652231
Author:
R. David Gustafson, Jeff Hughes
Publisher:
Cengage Learning