The change is in the image below Which of the following explaining the change on the graph A)Increase in supply B)Decrease in demand C)Decrease in supply D)Increase in demand
The change is in the image below Which of the following explaining the change on the graph A)Increase in supply B)Decrease in demand C)Decrease in supply D)Increase in demand

Economics (MindTap Course List)
13th Edition
ISBN:9781337617383
Author:Roger A. Arnold
Publisher:Roger A. Arnold
Chapter3: Supply And Demand: Theory
Section: Chapter Questions
Problem 4WNG

Related questions
Question
The change is in the image below
Which of the following explaining the change on the graph
A)Increase in supply
B)Decrease in demand
C)Decrease in supply
D)Increase in demand
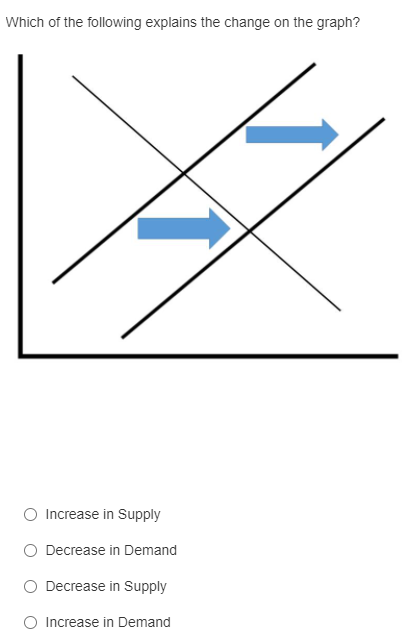
Transcribed Image Text:Which of the following explains the change on the graph?
O Increase in Supply
O Decrease in Demand
O Decrease in Supply
O Increase in Demand
Expert Solution
This question has been solved!
Explore an expertly crafted, step-by-step solution for a thorough understanding of key concepts.

This is a popular solution!

Trending now
This is a popular solution!

Step by step
Solved in 2 steps with 1 images

Recommended textbooks for you
Economics (MindTap Course List)
Economics
ISBN:
9781337617383
Author:
Roger A. Arnold
Publisher:
Cengage Learning


Economics (MindTap Course List)
Economics
ISBN:
9781337617383
Author:
Roger A. Arnold
Publisher:
Cengage Learning

Principles of Economics 2e
Economics
ISBN:
9781947172364
Author:
Steven A. Greenlaw; David Shapiro
Publisher:
OpenStax

