
Economics Today and Tomorrow, Student Edition
1st Edition
ISBN:9780078747663
Author:McGraw-Hill
Publisher:McGraw-Hill
Chapter7: Demand And Supply
Section7.2: The Demand Curve And Elasticity Of Demand
Problem 3R

Related questions
Question
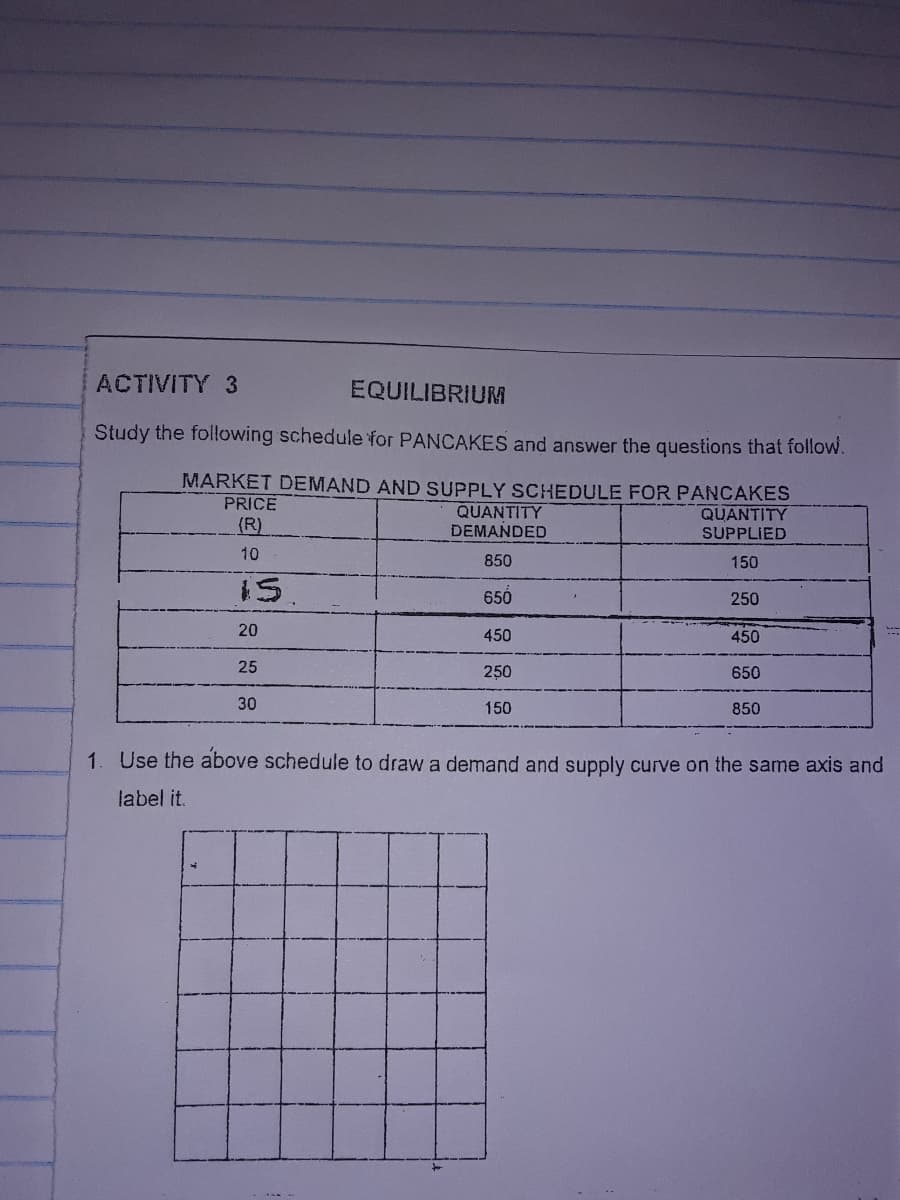
Transcribed Image Text:ACTIVITY 3
EQUILIBRIUM
Study the following schedule for PANCAKES and answer the questions that follow.
MARKET DEMAND AND SUPPLY SCHEDULE FOR PANCAKES
PRICE
(R)
QUANTITY
DEMANDED
QUANTITY
SUPPLIED
10
850
150
650
250
20
450
450
25
250
650
30
150
850
1. Use the above schedule to draw a demand and supply curve on the same axis and
label it.
Expert Solution
This question has been solved!
Explore an expertly crafted, step-by-step solution for a thorough understanding of key concepts.

This is a popular solution!

Trending now
This is a popular solution!

Step by step
Solved in 2 steps with 1 images

Knowledge Booster


Learn more about
Need a deep-dive on the concept behind this application? Look no further. Learn more about this topic, economics and related others by exploring similar questions and additional content below.Recommended textbooks for you
Economics Today and Tomorrow, Student Edition
Economics
ISBN:
9780078747663
Author:
McGraw-Hill
Publisher:
Glencoe/McGraw-Hill School Pub Co

Principles of Economics 2e
Economics
ISBN:
9781947172364
Author:
Steven A. Greenlaw; David Shapiro
Publisher:
OpenStax

Economics Today and Tomorrow, Student Edition
Economics
ISBN:
9780078747663
Author:
McGraw-Hill
Publisher:
Glencoe/McGraw-Hill School Pub Co
Principles of Economics 2e
Economics
ISBN:
9781947172364
Author:
Steven A. Greenlaw; David Shapiro
Publisher:
OpenStax


